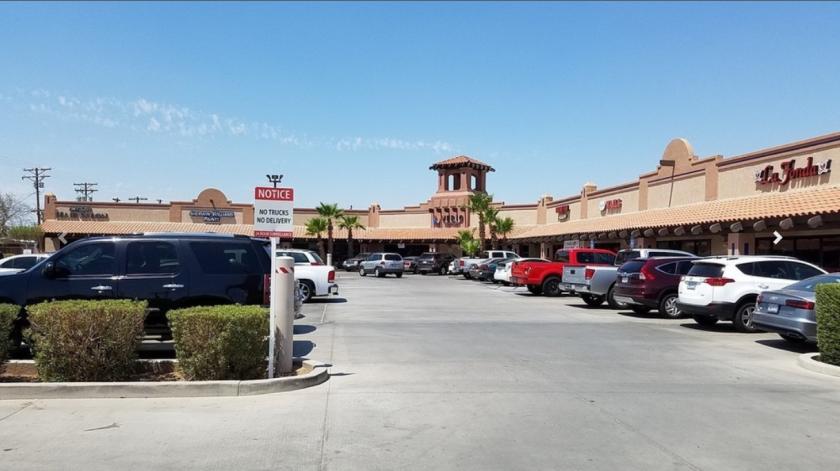
1-Mile | 3-Miles | 5-Miles | ||
---|---|---|---|---|
Total Population | 12,791 | 49,672 | 64,171 | |
Population Median Age | 37 | 35 | 35 | |
Population by Age | 0-9 Yrs | 1811 (14%) | 7886 (15%) | 10091 (15%) |
10-19 Yrs | 1970 (15%) | 8009 (16%) | 10678 (16%) | |
20-29 Yrs | 1808 (14%) | 6743 (13%) | 8852 (13%) | |
30-39 Yrs | 1346 (10%) | 6213 (12%) | 8266 (12%) | |
40-49 Yrs | 1758 (13%) | 5922 (11%) | 7723 (12%) | |
50-59 Yrs | 1619 (12%) | 5668 (11%) | 7032 (10%) | |
60-69 Yrs | 1229 (9%) | 4986 (10%) | 6009 (9%) | |
70+ Yrs | 1250 (9%) | 4245 (8%) | 5520 (8%) | |
Median HH Income | $51,454 | $49,355 | $52,207 | |
Total Household Income | < 24K | 955 (27%) | 3720 (28%) | 4514 (26%) |
25-49K | 699 (20%) | 2905 (22%) | 3639 (21%) | |
50-74K | 838 (24%) | 2107 (16%) | 2593 (15%) | |
75-99K | 266 (7%) | 1529 (11%) | 2376 (14%) | |
100-199K | 537 (15%) | 2321 (17%) | 3002 (17%) | |
200K+ | 132 (3%) | 504 (3%) | 694 (4%) | |
Highest Education Level | No Diploma | 2370 | 9012 | 11135 |
Diploma or GED | 1788 | 6481 | 8194 | |
Some College | 2115 | 7106 | 9453 | |
Assoc. Degree | 468 | 2155 | 2703 | |
Bachelors Degree | 874 | 3509 | 4653 | |
Higher Degree | 451 | 1988 | 2402 | |
Total Housing Units | 4,066 | 15,653 | 20,136 | |
--Owner-Occupied | 1,772 | 7,043 | 9,582 | |
--Renter-Occupied | 1,655 | 6,044 | 7,236 | |
Owner-Occupied Values | < 100K | 215 | 1230 | 1419 |
100-199K | 838 | 2245 | 2926 | |
200-299K | 442 | 2179 | 3441 | |
300-399K | 241 | 993 | 1290 | |
400-499K | 27 | 266 | 299 | |
500K+ | 8 | 130 | 207 | |
Total Working Age Population | 9,771 | 36,689 | 47,644 | |
In Work Force | 5,418 | 20,746 | 26,821 | |
Not In Work Force | 4,353 | 15,943 | 20,822 | |
Workforce Employed | 4,844 | 18,171 | 23,570 | |
Workforce Unemployed | 563 | 2,545 | 3,105 | |
Civlian Workforce | 5,407 | 20,715 | 26,676 | |
Military Workforce | 12 | 31 | 146 | |
Total Households | 3,427 | 13,088 | 16,818 | |
Family Households | 2,699 | 10,269 | 13,253 | |
Non-Family Households | 728 | 2,819 | 3,565 | |
Married Couple | 1,714 | 6,478 | 8,426 | |
Other Family | 985 | 3,791 | 4,827 | |
Married w/Child | 801 | 2,740 | 3,682 | |
Single Male w/Child | 55 | 385 | 546 | |
Single Female w/Child | 219 | 1,335 | 1,684 |
Population Change Last Two Decades - Plus Projection
2000 | % | 2010 | % | 2020 | % | 2030 | |
---|---|---|---|---|---|---|---|
California | 33,871,648 | +10 | 37,253,956 | +9 | 40,467,295 | +8 | 43,631,295 |
Imperial County | 142,361 | +23 | 174,528 | +11 | 193,458 | +11 | 215,196 |
Total Working Age Population:
Total Households:
Total Working Age Population:
Total Households:
Total Working Age Population:
Total Households: