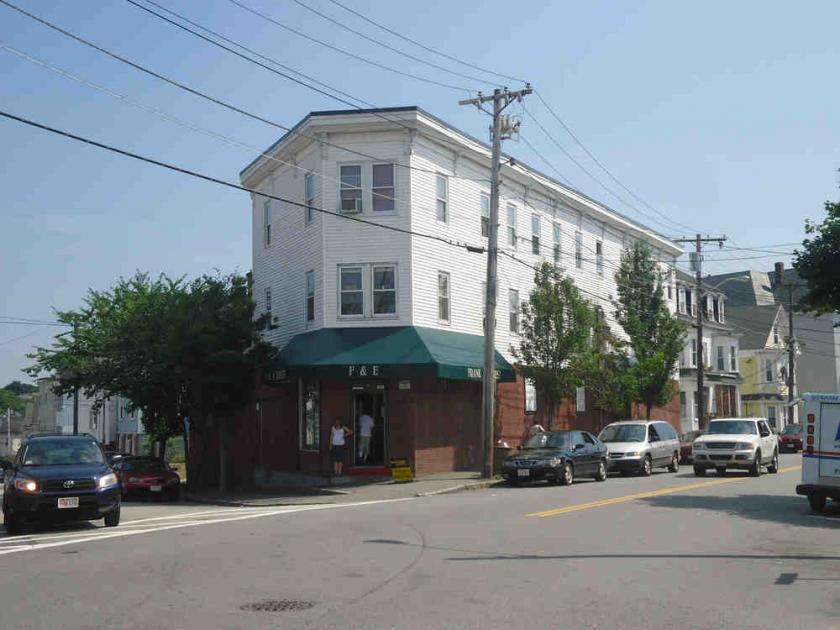
1-Mile | 3-Miles | 5-Miles | ||
---|---|---|---|---|
Total Population | 35,858 | 139,430 | 211,032 | |
Population Median Age | 35 | 36 | 38 | |
Population by Age | 0-9 Yrs | 5014 (13%) | 16987 (12%) | 24741 (11%) |
10-19 Yrs | 4662 (13%) | 18590 (13%) | 27682 (13%) | |
20-29 Yrs | 5706 (15%) | 25264 (18%) | 32596 (15%) | |
30-39 Yrs | 5830 (16%) | 19467 (13%) | 28440 (13%) | |
40-49 Yrs | 4713 (13%) | 17033 (12%) | 26881 (12%) | |
50-59 Yrs | 4284 (11%) | 18037 (12%) | 29282 (13%) | |
60-69 Yrs | 3318 (9%) | 13580 (9%) | 22649 (10%) | |
70+ Yrs | 2332 (6%) | 10472 (7%) | 18760 (8%) | |
Median HH Income | $44,043 | $62,013 | $74,593 | |
Total Household Income | < 24K | 4649 (33%) | 11800 (23%) | 14767 (19%) |
25-49K | 2767 (19%) | 9098 (18%) | 12683 (16%) | |
50-74K | 1997 (14%) | 7592 (15%) | 10847 (14%) | |
75-99K | 1609 (11%) | 6737 (13%) | 10062 (13%) | |
100-199K | 2445 (17%) | 11619 (23%) | 21470 (28%) | |
200K+ | 374 (2%) | 2461 (4%) | 6427 (8%) | |
Highest Education Level | No Diploma | 5373 | 14557 | 17874 |
Diploma or GED | 8037 | 30278 | 43394 | |
Some College | 3710 | 15314 | 23782 | |
Assoc. Degree | 1367 | 5991 | 10244 | |
Bachelors Degree | 3244 | 14393 | 27218 | |
Higher Degree | 1820 | 9685 | 18907 | |
Total Housing Units | 14,569 | 52,168 | 80,028 | |
--Owner-Occupied | 4,569 | 23,716 | 45,332 | |
--Renter-Occupied | 9,272 | 25,591 | 30,924 | |
Owner-Occupied Values | < 100K | 131 | 673 | 1187 |
100-199K | 1124 | 3785 | 5277 | |
200-299K | 1778 | 8039 | 11982 | |
300-399K | 897 | 6411 | 12831 | |
400-499K | 413 | 2995 | 7748 | |
500K+ | 226 | 1813 | 6307 | |
Total Working Age Population | 28,093 | 113,027 | 171,642 | |
In Work Force | 18,143 | 75,173 | 115,286 | |
Not In Work Force | 9,949 | 37,854 | 56,356 | |
Workforce Employed | 16,955 | 70,977 | 109,207 | |
Workforce Unemployed | 1,188 | 4,194 | 6,046 | |
Civlian Workforce | 18,143 | 75,171 | 115,253 | |
Military Workforce | 0 | 2 | 33 | |
Total Households | 13,841 | 49,307 | 76,256 | |
Family Households | 7,563 | 30,808 | 49,750 | |
Non-Family Households | 6,278 | 18,498 | 26,506 | |
Married Couple | 4,101 | 18,842 | 33,715 | |
Other Family | 3,462 | 11,967 | 16,035 | |
Married w/Child | 1,914 | 7,852 | 13,748 | |
Single Male w/Child | 359 | 922 | 1,345 | |
Single Female w/Child | 1,540 | 4,703 | 6,255 |
Population Change Last Two Decades - Plus Projection
2000 | % | 2010 | % | 2020 | % | 2030 | |
---|---|---|---|---|---|---|---|
Massachusetts | 6,349,097 | +3 | 6,547,629 | +6 | 6,933,887 | +4 | 7,225,472 |
Essex County | 723,419 | +3 | 743,159 | +6 | 790,035 | +3 | 816,022 |
Middlesex County | 1,465,396 | +3 | 1,503,085 | +7 | 1,613,961 | +5 | 1,686,641 |
New Hampshire | 1,235,786 | +7 | 1,316,470 | +3 | 1,349,908 | +4 | 1,402,878 |
Hillsborough County | 380,841 | +5 | 400,721 | +2 | 409,478 | +4 | 424,492 |
Total Working Age Population:
Total Households:
Total Working Age Population:
Total Households:
Total Working Age Population:
Total Households: