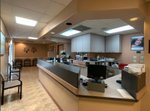
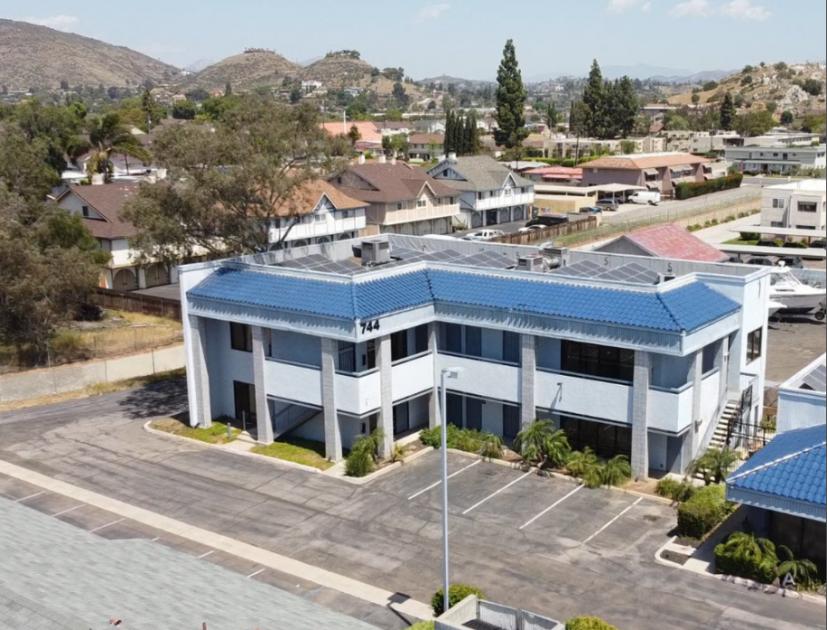
1-Mile | 3-Miles | 5-Miles | ||
---|---|---|---|---|
Total Population | 33,820 | 162,315 | 327,494 | |
Population Median Age | 34 | 37 | 38 | |
Population by Age | 0-9 Yrs | 5006 (14%) | 22107 (13%) | 42262 (12%) |
10-19 Yrs | 4513 (13%) | 19959 (12%) | 39629 (12%) | |
20-29 Yrs | 6752 (19%) | 26148 (16%) | 48021 (14%) | |
30-39 Yrs | 5004 (14%) | 23027 (14%) | 45950 (14%) | |
40-49 Yrs | 3819 (11%) | 19004 (11%) | 41002 (12%) | |
50-59 Yrs | 4202 (12%) | 20731 (12%) | 42024 (12%) | |
60-69 Yrs | 2423 (7%) | 16867 (10%) | 36237 (11%) | |
70+ Yrs | 2102 (6%) | 14473 (8%) | 32368 (9%) | |
Median HH Income | $45,196 | $61,878 | $72,310 | |
Total Household Income | < 24K | 2957 (26%) | 9991 (18%) | 17194 (15%) |
25-49K | 3261 (28%) | 11659 (22%) | 21013 (19%) | |
50-74K | 1986 (17%) | 9190 (17%) | 18940 (17%) | |
75-99K | 1305 (11%) | 7220 (13%) | 15580 (14%) | |
100-199K | 1542 (13%) | 11225 (21%) | 28809 (26%) | |
200K+ | 245 (2%) | 3387 (6%) | 8904 (8%) | |
Highest Education Level | No Diploma | 3799 | 14830 | 22769 |
Diploma or GED | 7034 | 30602 | 55455 | |
Some College | 5466 | 29340 | 61053 | |
Assoc. Degree | 1523 | 9177 | 20682 | |
Bachelors Degree | 2755 | 17174 | 41822 | |
Higher Degree | 717 | 7772 | 22145 | |
Total Housing Units | 11,613 | 54,501 | 115,300 | |
--Owner-Occupied | 2,840 | 24,754 | 61,582 | |
--Renter-Occupied | 8,456 | 27,919 | 48,857 | |
Owner-Occupied Values | < 100K | 562 | 3152 | 5321 |
100-199K | 233 | 1109 | 2076 | |
200-299K | 484 | 1757 | 3484 | |
300-399K | 354 | 3113 | 7371 | |
400-499K | 969 | 6196 | 14338 | |
500K+ | 238 | 9427 | 28991 | |
Total Working Age Population | 25,909 | 127,859 | 261,171 | |
In Work Force | 17,337 | 81,203 | 167,551 | |
Not In Work Force | 8,571 | 46,656 | 93,619 | |
Workforce Employed | 15,727 | 74,193 | 154,006 | |
Workforce Unemployed | 1,355 | 6,047 | 10,944 | |
Civlian Workforce | 17,083 | 80,241 | 164,950 | |
Military Workforce | 254 | 962 | 2,601 | |
Total Households | 11,296 | 52,673 | 110,439 | |
Family Households | 7,741 | 37,561 | 78,523 | |
Non-Family Households | 3,554 | 15,112 | 31,915 | |
Married Couple | 4,775 | 26,398 | 57,030 | |
Other Family | 2,966 | 11,162 | 21,493 | |
Married w/Child | 2,307 | 12,063 | 24,769 | |
Single Male w/Child | 335 | 1,172 | 2,613 | |
Single Female w/Child | 1,250 | 3,965 | 7,452 |
Population Change Last Two Decades - Plus Projection
2000 | % | 2010 | % | 2020 | % | 2030 | |
---|---|---|---|---|---|---|---|
California | 33,871,648 | +10 | 37,253,956 | +9 | 40,467,295 | +8 | 43,631,295 |
San Diego County | 2,813,833 | +10 | 3,095,313 | +10 | 3,390,529 | +6 | 3,608,286 |
Total Working Age Population:
Total Households:
Total Working Age Population:
Total Households:
Total Working Age Population:
Total Households: