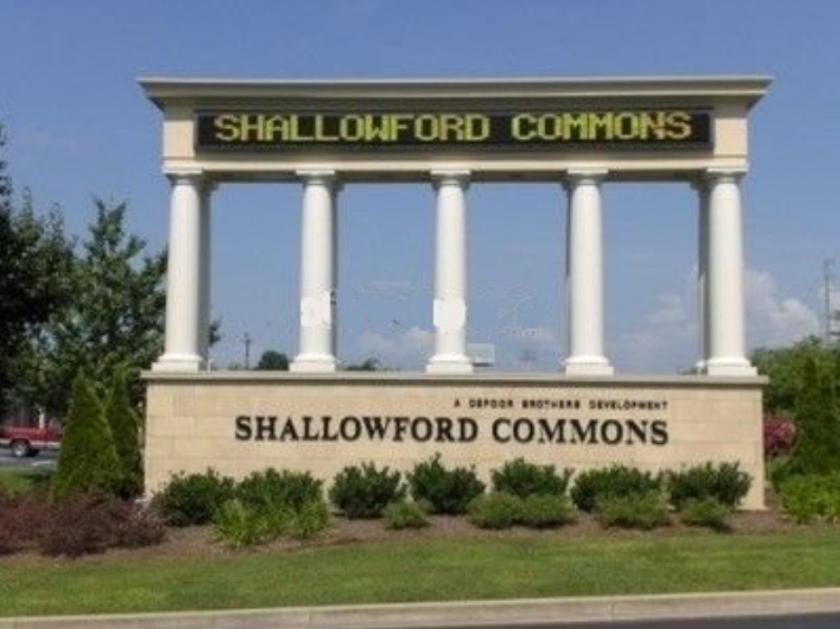
1-Mile | 3-Miles | 5-Miles | ||
---|---|---|---|---|
Total Population | 3,250 | 36,026 | 112,097 | |
Population Median Age | 48 | 42 | 41 | |
Population by Age | 0-9 Yrs | 216 (6%) | 3576 (9%) | 12342 (11%) |
10-19 Yrs | 215 (6%) | 3364 (9%) | 12046 (10%) | |
20-29 Yrs | 399 (12%) | 5947 (16%) | 16045 (14%) | |
30-39 Yrs | 378 (11%) | 4623 (12%) | 14813 (13%) | |
40-49 Yrs | 404 (12%) | 4113 (11%) | 13944 (12%) | |
50-59 Yrs | 386 (11%) | 5129 (14%) | 14979 (13%) | |
60-69 Yrs | 649 (19%) | 4262 (11%) | 14252 (12%) | |
70+ Yrs | 605 (18%) | 5013 (13%) | 13678 (12%) | |
Median HH Income | $48,565 | $46,346 | $48,860 | |
Total Household Income | < 24K | 340 (20%) | 3846 (23%) | 11276 (24%) |
25-49K | 525 (31%) | 5094 (30%) | 12633 (26%) | |
50-74K | 344 (20%) | 3146 (19%) | 8428 (17%) | |
75-99K | 157 (9%) | 1883 (11%) | 5742 (12%) | |
100-199K | 259 (15%) | 2210 (13%) | 7169 (15%) | |
200K+ | 51 (3%) | 317 (1%) | 1598 (3%) | |
Highest Education Level | No Diploma | 192 | 2522 | 9460 |
Diploma or GED | 701 | 7746 | 22857 | |
Some College | 786 | 7221 | 19408 | |
Assoc. Degree | 284 | 2694 | 7476 | |
Bachelors Degree | 424 | 4434 | 14371 | |
Higher Degree | 294 | 2421 | 7908 | |
Total Housing Units | 1,846 | 18,267 | 52,134 | |
--Owner-Occupied | 965 | 8,368 | 26,135 | |
--Renter-Occupied | 712 | 8,127 | 20,710 | |
Owner-Occupied Values | < 100K | 150 | 1562 | 5079 |
100-199K | 596 | 5014 | 13518 | |
200-299K | 180 | 1312 | 4723 | |
300-399K | 15 | 269 | 1443 | |
400-499K | 0 | 66 | 519 | |
500K+ | 24 | 146 | 853 | |
Total Working Age Population | 2,887 | 30,318 | 92,463 | |
In Work Force | 1,631 | 18,702 | 57,562 | |
Not In Work Force | 1,256 | 11,616 | 34,901 | |
Workforce Employed | 1,598 | 17,948 | 54,672 | |
Workforce Unemployed | 33 | 737 | 2,853 | |
Civlian Workforce | 1,631 | 18,685 | 57,526 | |
Military Workforce | 0 | 17 | 37 | |
Total Households | 1,676 | 16,496 | 46,845 | |
Family Households | 896 | 8,367 | 26,611 | |
Non-Family Households | 780 | 8,128 | 20,234 | |
Married Couple | 612 | 5,564 | 18,105 | |
Other Family | 284 | 2,803 | 8,506 | |
Married w/Child | 79 | 1,601 | 5,810 | |
Single Male w/Child | 6 | 361 | 793 | |
Single Female w/Child | 138 | 955 | 3,278 |
Population Change Last Two Decades - Plus Projection
2000 | % | 2010 | % | 2020 | % | 2030 | |
---|---|---|---|---|---|---|---|
Georgia | 8,186,453 | +18 | 9,687,653 | +12 | 10,833,472 | +13 | 12,292,423 |
Catoosa County | 53,282 | +20 | 63,942 | +8 | 68,771 | +7 | 73,567 |
Walker County | 61,053 | +13 | 68,756 | +1 | 69,610 | +2 | 71,128 |
Whitfield County | 83,525 | +23 | 102,599 | +2 | 104,672 | +4 | 108,534 |
Tennessee | 5,689,283 | +12 | 6,346,105 | +9 | 6,886,369 | +7 | 7,393,069 |
Hamilton County | 307,896 | +9 | 336,463 | +10 | 369,802 | +6 | 393,428 |
Total Working Age Population:
Total Households:
Total Working Age Population:
Total Households:
Total Working Age Population:
Total Households: