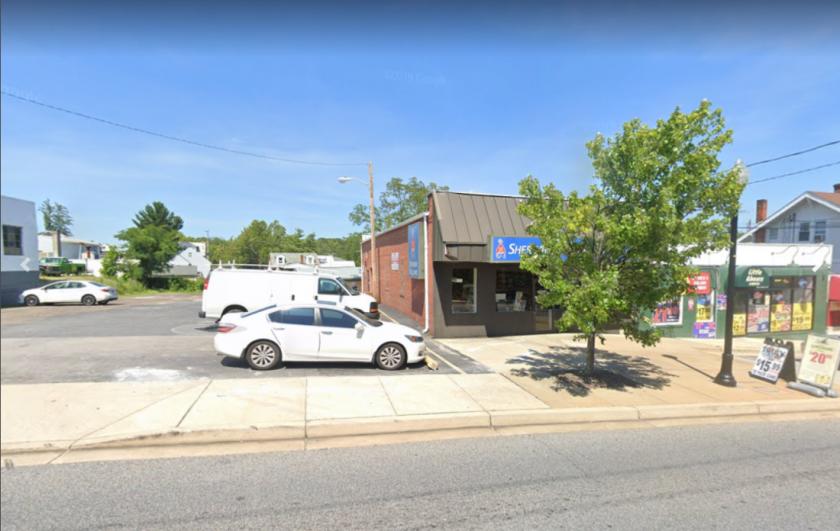
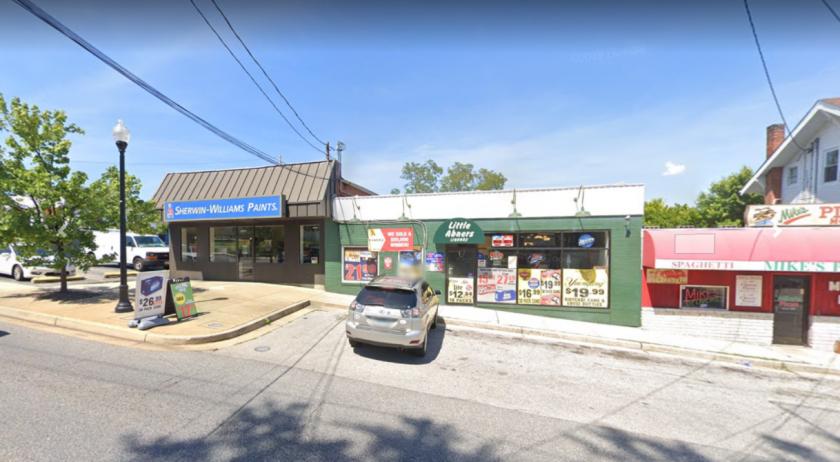
Retail Space
1306 Linden Avenue Arbutus, MD 21227
1306 Linden Avenue Arbutus, MD 21227
Details & Description
Property Highlights
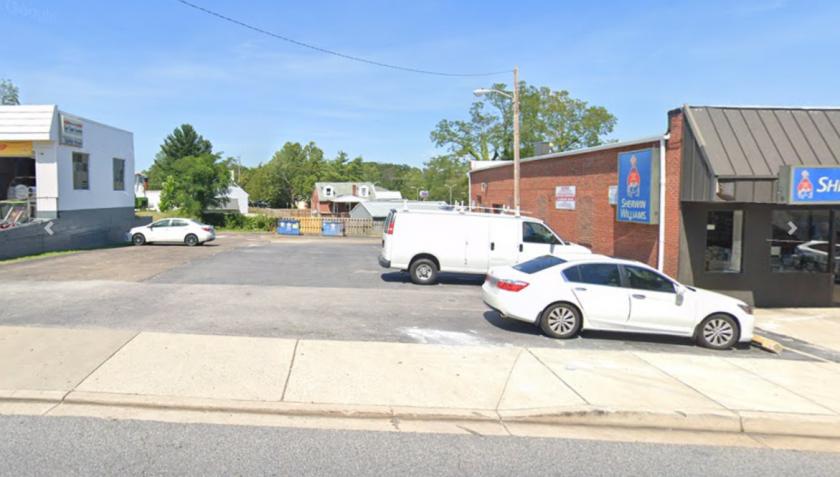
• Adjacent parking lot for sale $145,000
• Building for sale $560,000
Listing Agents

Helen Dellheim
O: 410-312-0000
M: 410-258-4136
helen@wincommercial.com
O: 410-312-0000
M: 410-258-4136
helen@wincommercial.com
While we strive to provide the most accurate information, all listing information, and demographic data, is provided by third-parties. As such, MyEListing will not be responsible for the accuracy of the information. It is strongly recommended that you verify all information with the listing agent, and any relevant agencies, prior to making any decisions.