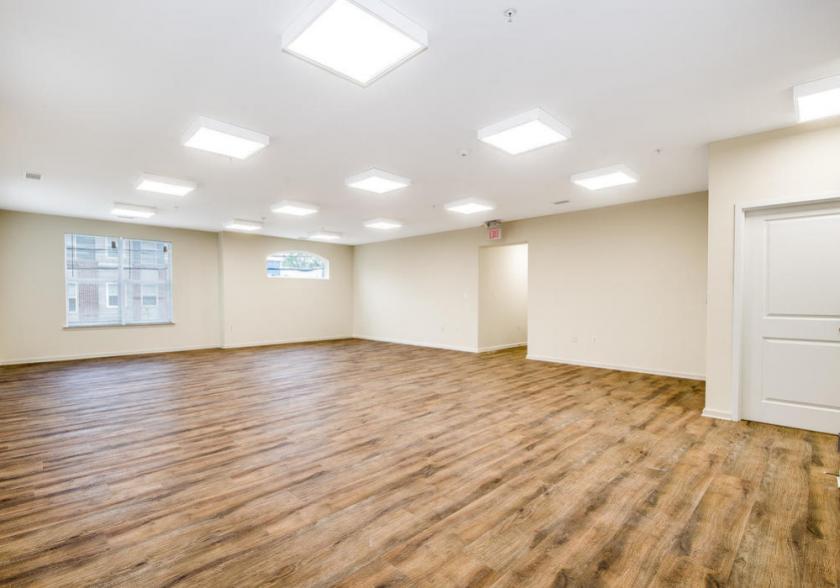
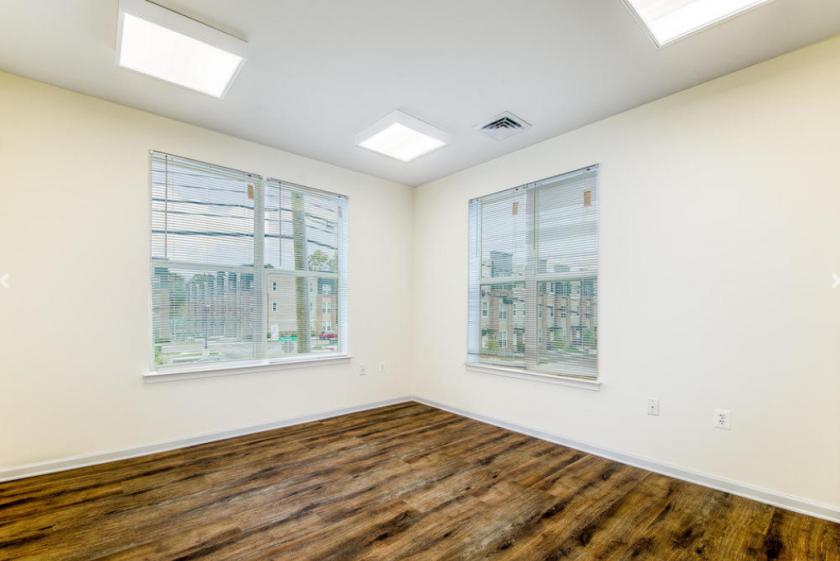
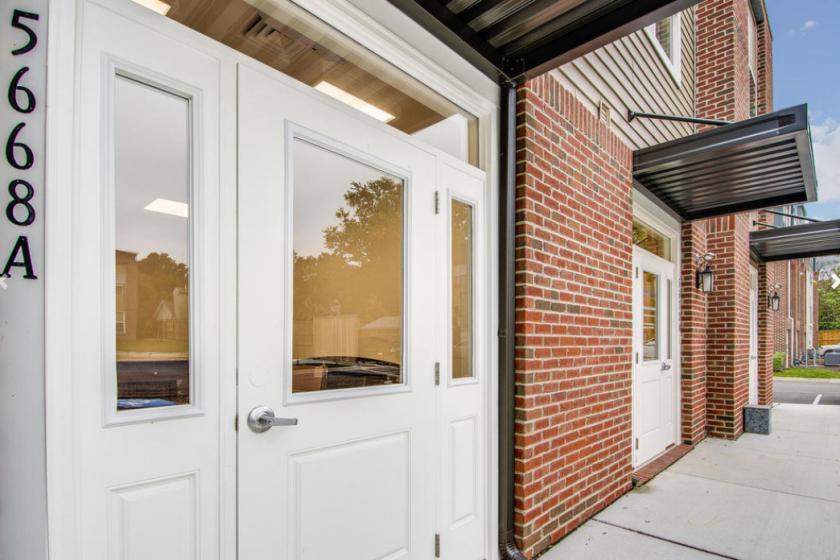
1-Mile | 3-Miles | 5-Miles | ||
---|---|---|---|---|
Total Population | 3,484 | 43,680 | 197,064 | |
Population Median Age | 38 | 37 | 37 | |
Population by Age | 0-9 Yrs | 385 (11%) | 4929 (11%) | 26392 (13%) |
10-19 Yrs | 553 (15%) | 6258 (14%) | 25131 (12%) | |
20-29 Yrs | 367 (10%) | 6445 (14%) | 28685 (14%) | |
30-39 Yrs | 448 (12%) | 6565 (15%) | 30284 (15%) | |
40-49 Yrs | 517 (14%) | 5143 (11%) | 23322 (11%) | |
50-59 Yrs | 639 (18%) | 6495 (14%) | 26569 (13%) | |
60-69 Yrs | 337 (9%) | 4309 (9%) | 19007 (9%) | |
70+ Yrs | 239 (6%) | 3536 (8%) | 17674 (8%) | |
Median HH Income | $131,135 | $95,331 | $80,037 | |
Total Household Income | < 24K | 73 (6%) | 1279 (8%) | 10185 (14%) |
25-49K | 105 (9%) | 2268 (14%) | 12437 (17%) | |
50-74K | 120 (10%) | 2129 (13%) | 11303 (15%) | |
75-99K | 132 (11%) | 2567 (16%) | 10167 (14%) | |
100-199K | 483 (41%) | 5264 (33%) | 20403 (28%) | |
200K+ | 245 (21%) | 2019 (13%) | 7454 (10%) | |
Highest Education Level | No Diploma | 122 | 2080 | 13852 |
Diploma or GED | 480 | 7503 | 35407 | |
Some College | 397 | 5277 | 24376 | |
Assoc. Degree | 184 | 2029 | 9326 | |
Bachelors Degree | 608 | 6990 | 27758 | |
Higher Degree | 555 | 5028 | 21449 | |
Total Housing Units | 1,205 | 16,387 | 77,449 | |
--Owner-Occupied | 985 | 11,734 | 47,226 | |
--Renter-Occupied | 174 | 3,791 | 24,722 | |
Owner-Occupied Values | < 100K | 33 | 430 | 3976 |
100-199K | 67 | 1480 | 8500 | |
200-299K | 211 | 4090 | 13702 | |
300-399K | 218 | 2366 | 10042 | |
400-499K | 202 | 1592 | 4866 | |
500K+ | 254 | 1777 | 6140 | |
Total Working Age Population | 2,696 | 35,400 | 155,778 | |
In Work Force | 1,981 | 24,911 | 107,389 | |
Not In Work Force | 715 | 10,489 | 48,388 | |
Workforce Employed | 1,936 | 23,496 | 101,491 | |
Workforce Unemployed | 29 | 1,098 | 4,685 | |
Civlian Workforce | 1,965 | 24,594 | 106,176 | |
Military Workforce | 16 | 316 | 1,213 | |
Total Households | 1,159 | 15,525 | 71,948 | |
Family Households | 976 | 10,642 | 47,710 | |
Non-Family Households | 183 | 4,882 | 24,238 | |
Married Couple | 797 | 8,193 | 32,867 | |
Other Family | 178 | 2,450 | 14,843 | |
Married w/Child | 322 | 3,440 | 14,398 | |
Single Male w/Child | 14 | 300 | 1,551 | |
Single Female w/Child | 90 | 960 | 5,732 |
Population Change Last Two Decades - Plus Projection
2000 | % | 2010 | % | 2020 | % | 2030 | |
---|---|---|---|---|---|---|---|
Maryland | 5,296,486 | +9 | 5,773,552 | +6 | 6,141,900 | +6 | 6,518,750 |
Anne Arundel County | 489,656 | +10 | 537,656 | +7 | 573,250 | +4 | 596,700 |
Baltimore County | 754,292 | +7 | 805,029 | +5 | 847,000 | +2 | 862,200 |
Howard County | 247,842 | +16 | 287,085 | +17 | 336,900 | +9 | 366,800 |
Baltimore city | 651,154 | -5 | 620,961 | -1 | 616,300 | +1 | 625,100 |
Total Working Age Population:
Total Households:
Total Working Age Population:
Total Households:
Total Working Age Population:
Total Households: