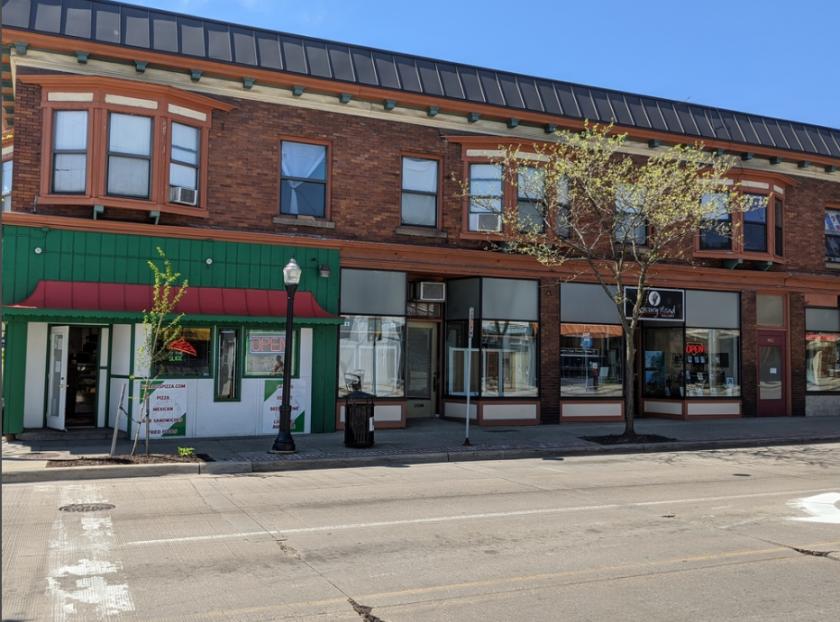
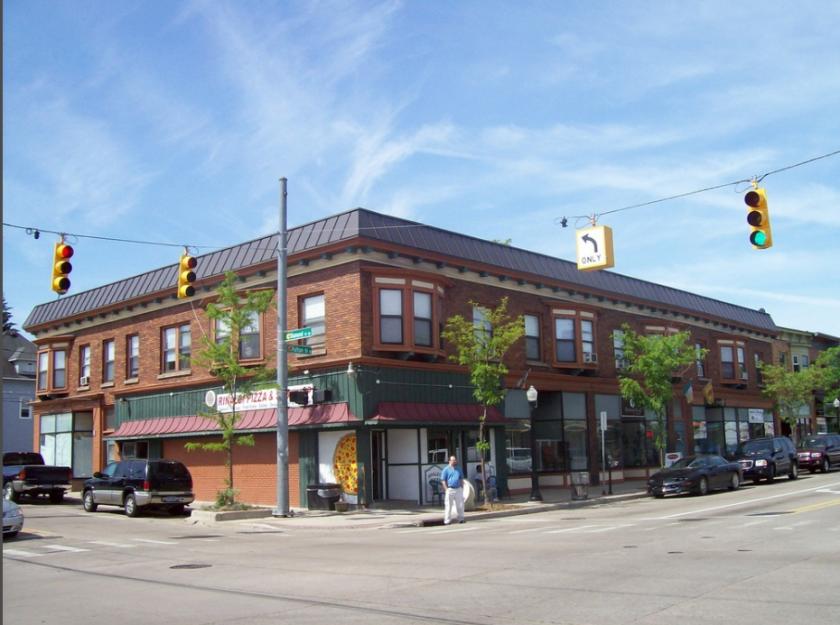
1-Mile | 3-Miles | 5-Miles | ||
---|---|---|---|---|
Total Population | 23,912 | 141,844 | 264,384 | |
Population Median Age | 33 | 34 | 36 | |
Population by Age | 0-9 Yrs | 1751 (7%) | 19375 (13%) | 34958 (13%) |
10-19 Yrs | 2742 (11%) | 18325 (12%) | 34491 (13%) | |
20-29 Yrs | 7935 (33%) | 32045 (22%) | 51664 (19%) | |
30-39 Yrs | 4354 (18%) | 22083 (15%) | 39084 (14%) | |
40-49 Yrs | 2086 (8%) | 15149 (10%) | 28634 (10%) | |
50-59 Yrs | 2370 (9%) | 15114 (10%) | 29984 (11%) | |
60-69 Yrs | 1749 (7%) | 10958 (7%) | 23759 (8%) | |
70+ Yrs | 926 (3%) | 8796 (6%) | 21810 (8%) | |
Median HH Income | $53,569 | $50,423 | $54,114 | |
Total Household Income | < 24K | 2273 (22%) | 13200 (24%) | 22204 (22%) |
25-49K | 2434 (24%) | 13177 (24%) | 24256 (24%) | |
50-74K | 1951 (19%) | 9607 (18%) | 18813 (18%) | |
75-99K | 1170 (11%) | 6078 (11%) | 12652 (12%) | |
100-199K | 1690 (16%) | 8289 (15%) | 16623 (16%) | |
200K+ | 477 (4%) | 2745 (5%) | 4829 (4%) | |
Highest Education Level | No Diploma | 1181 | 12340 | 21535 |
Diploma or GED | 2340 | 17915 | 37909 | |
Some College | 2834 | 17018 | 34093 | |
Assoc. Degree | 1226 | 6495 | 13223 | |
Bachelors Degree | 5676 | 22993 | 41820 | |
Higher Degree | 2680 | 12349 | 22015 | |
Total Housing Units | 11,035 | 58,078 | 106,726 | |
--Owner-Occupied | 4,333 | 28,539 | 59,779 | |
--Renter-Occupied | 5,663 | 24,557 | 39,598 | |
Owner-Occupied Values | < 100K | 750 | 7469 | 13491 |
100-199K | 2036 | 12287 | 28962 | |
200-299K | 971 | 4232 | 9065 | |
300-399K | 341 | 1942 | 3823 | |
400-499K | 73 | 948 | 1870 | |
500K+ | 161 | 1660 | 2569 | |
Total Working Age Population | 20,790 | 111,438 | 209,211 | |
In Work Force | 15,942 | 79,182 | 144,207 | |
Not In Work Force | 4,848 | 32,256 | 65,004 | |
Workforce Employed | 14,942 | 74,060 | 136,092 | |
Workforce Unemployed | 998 | 5,101 | 8,001 | |
Civlian Workforce | 15,940 | 79,160 | 144,093 | |
Military Workforce | 2 | 22 | 114 | |
Total Households | 9,996 | 53,096 | 99,377 | |
Family Households | 3,976 | 29,406 | 58,206 | |
Non-Family Households | 6,020 | 23,690 | 41,171 | |
Married Couple | 2,781 | 18,656 | 39,740 | |
Other Family | 1,195 | 10,750 | 18,466 | |
Married w/Child | 1,022 | 8,007 | 16,724 | |
Single Male w/Child | 116 | 1,623 | 2,771 | |
Single Female w/Child | 554 | 4,802 | 7,652 |
Population Change Last Two Decades - Plus Projection
2000 | % | 2010 | % | 2020 | % | 2030 | |
---|---|---|---|---|---|---|---|
Michigan | 9,938,444 | -1 | 9,883,640 | +1 | 10,023,423 | +4 | 10,424,510 |
Kent County | 574,335 | +5 | 602,622 | +11 | 668,535 | +12 | 746,921 |
Total Working Age Population:
Total Households:
Total Working Age Population:
Total Households:
Total Working Age Population:
Total Households: