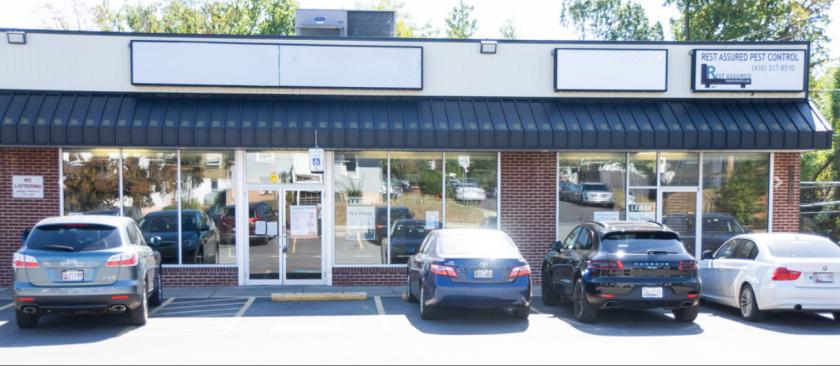
Retail Space
1305 Francis Avenue Halethorpe, MD 21227
1305 Francis Avenue Halethorpe, MD 21227
Details & Description
Property Highlights
- • 7-Eleven anchored strip
- • Only shopping center in neighborhood
- • 188 ft Francis Ave frontage with signage
- • Within US-1, I-95, I-195 corridor
- • 6 Minute walk to Halethorpe station MARC
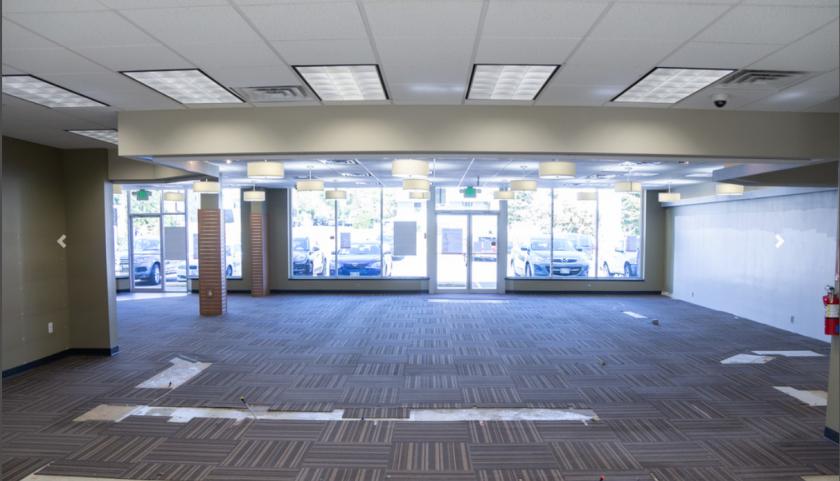
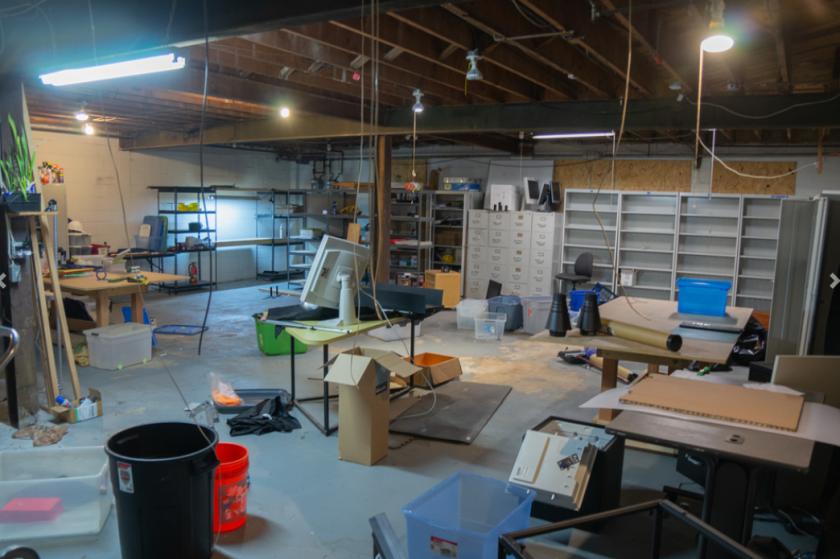
Additional Photos

Listing Agents

Helen Dellheim
O: 410-312-0000
M: 410-258-4136
helen@wincommercial.com
O: 410-312-0000
M: 410-258-4136
helen@wincommercial.com
While we strive to provide the most accurate information, all listing information, and demographic data, is provided by third-parties. As such, MyEListing will not be responsible for the accuracy of the information. It is strongly recommended that you verify all information with the listing agent, and any relevant agencies, prior to making any decisions.


