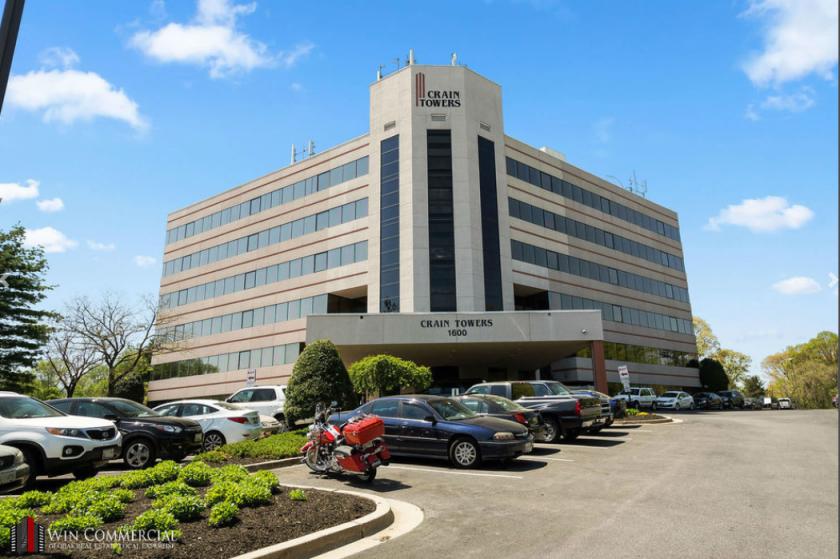
Office Space
1600 Crain Highway South Glen Burnie, MD 21061
1600 Crain Highway South Glen Burnie, MD 21061
Details & Description
Property Highlights
- • Parking Ratio of 5 spaces per 1,000sf
- • Pharmacy, Radiology, and Labcorp in building
- • New cooling tower to be installed by early June
- • Excellent Crain Hwy frontage 18,520 VPD
- • Visibility from Rte 100 75,908 VPD
- • On site property manager
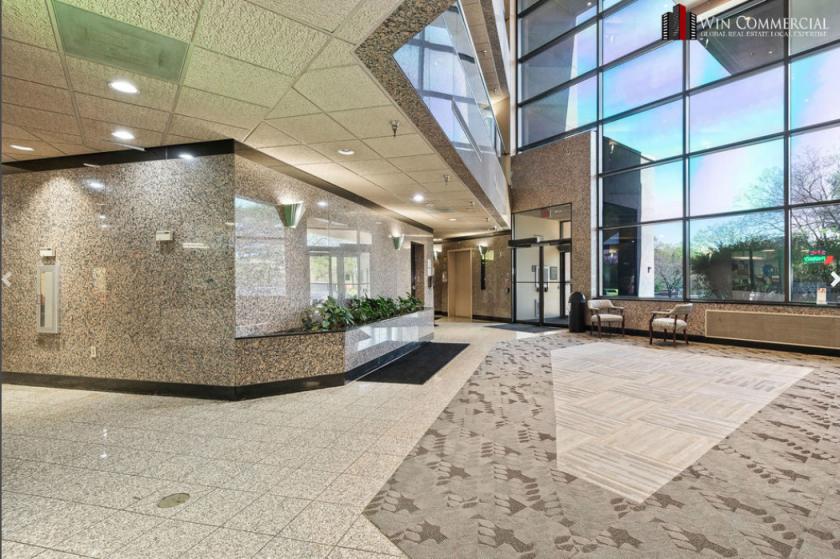
Additional Photos


Listing Agents

Helen Dellheim
O: 410-312-0000
M: 410-258-4136
helen@wincommercial.com
O: 410-312-0000
M: 410-258-4136
helen@wincommercial.com

Ravinder Sawhney
KW Commercial
O: 410-312-0000
M: 443-255-0373
rsawhney@kwcommercial.com
KW Commercial
O: 410-312-0000
M: 443-255-0373
rsawhney@kwcommercial.com
While we strive to provide the most accurate information, all listing information, and demographic data, is provided by third-parties. As such, MyEListing will not be responsible for the accuracy of the information. It is strongly recommended that you verify all information with the listing agent, and any relevant agencies, prior to making any decisions.


