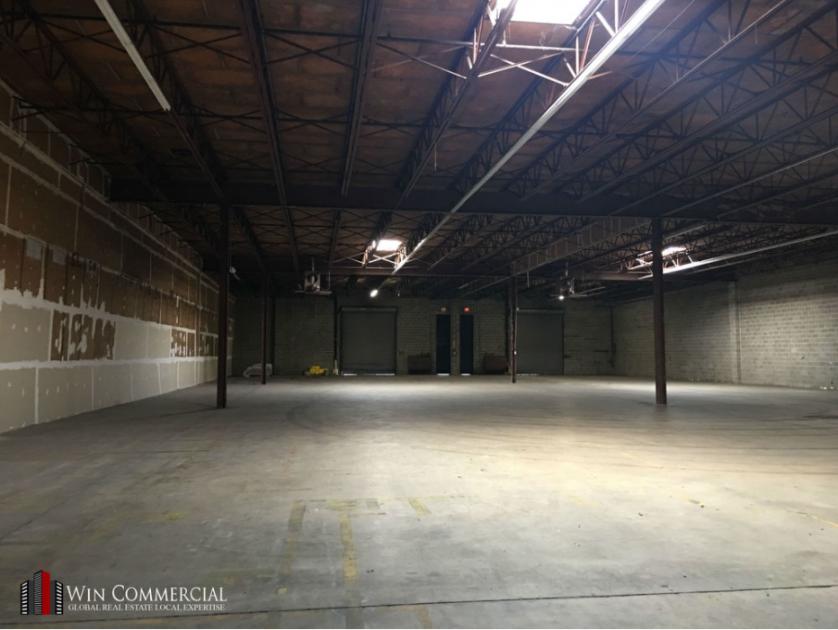
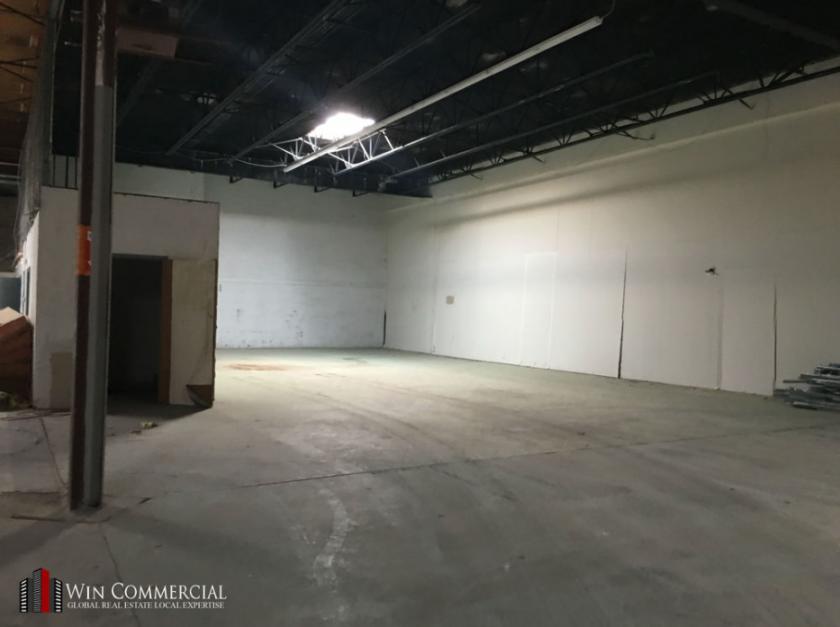
1-Mile | 3-Miles | 5-Miles | ||
---|---|---|---|---|
Total Population | 4,707 | 25,244 | 55,790 | |
Population Median Age | 35 | 37 | 39 | |
Population by Age | 0-9 Yrs | 559 (11%) | 2955 (11%) | 6214 (11%) |
10-19 Yrs | 818 (17%) | 3481 (13%) | 7253 (13%) | |
20-29 Yrs | 564 (11%) | 3108 (12%) | 6594 (11%) | |
30-39 Yrs | 796 (16%) | 3769 (14%) | 7155 (12%) | |
40-49 Yrs | 771 (16%) | 4036 (15%) | 8407 (15%) | |
50-59 Yrs | 625 (13%) | 4019 (15%) | 9405 (16%) | |
60-69 Yrs | 352 (7%) | 2341 (9%) | 6376 (11%) | |
70+ Yrs | 222 (4%) | 1535 (6%) | 4385 (7%) | |
Median HH Income | $127,948 | $116,474 | $114,705 | |
Total Household Income | < 24K | 82 (4%) | 595 (6%) | 1485 (7%) |
25-49K | 135 (7%) | 706 (7%) | 1845 (9%) | |
50-74K | 141 (7%) | 937 (10%) | 2228 (11%) | |
75-99K | 320 (17%) | 1493 (16%) | 2960 (14%) | |
100-199K | 763 (42%) | 3660 (40%) | 8043 (39%) | |
200K+ | 340 (19%) | 1642 (18%) | 3648 (18%) | |
Highest Education Level | No Diploma | 82 | 885 | 1948 |
Diploma or GED | 626 | 4102 | 8840 | |
Some College | 846 | 3937 | 9031 | |
Assoc. Degree | 141 | 1099 | 2531 | |
Bachelors Degree | 740 | 4044 | 8970 | |
Higher Degree | 644 | 3209 | 7623 | |
Total Housing Units | 1,995 | 9,683 | 21,194 | |
--Owner-Occupied | 1,303 | 7,548 | 17,460 | |
--Renter-Occupied | 478 | 1,485 | 2,749 | |
Owner-Occupied Values | < 100K | 21 | 367 | 1025 |
100-199K | 88 | 838 | 1561 | |
200-299K | 432 | 1987 | 4065 | |
300-399K | 243 | 1780 | 4398 | |
400-499K | 252 | 1308 | 3204 | |
500K+ | 268 | 1268 | 3207 | |
Total Working Age Population | 3,781 | 20,395 | 45,361 | |
In Work Force | 2,895 | 14,395 | 31,627 | |
Not In Work Force | 886 | 5,999 | 13,734 | |
Workforce Employed | 2,725 | 13,724 | 30,292 | |
Workforce Unemployed | 121 | 535 | 1,099 | |
Civlian Workforce | 2,846 | 14,259 | 31,392 | |
Military Workforce | 49 | 136 | 235 | |
Total Households | 1,781 | 9,034 | 20,209 | |
Family Households | 1,237 | 6,119 | 13,906 | |
Non-Family Households | 543 | 2,915 | 6,303 | |
Married Couple | 721 | 4,020 | 9,507 | |
Other Family | 516 | 2,098 | 4,399 | |
Married w/Child | 374 | 1,892 | 3,882 | |
Single Male w/Child | 78 | 192 | 462 | |
Single Female w/Child | 86 | 637 | 1,321 |
Population Change Last Two Decades - Plus Projection
2000 | % | 2010 | % | 2020 | % | 2030 | |
---|---|---|---|---|---|---|---|
Maryland | 5,296,486 | +9 | 5,773,552 | +6 | 6,141,900 | +6 | 6,518,750 |
Anne Arundel County | 489,656 | +10 | 537,656 | +7 | 573,250 | +4 | 596,700 |
Calvert County | 74,563 | +19 | 88,737 | +7 | 94,600 | +5 | 99,200 |
Prince Georges County | 801,515 | +8 | 863,420 | +6 | 916,150 | +4 | 952,950 |
Total Working Age Population:
Total Households:
Total Working Age Population:
Total Households:
Total Working Age Population:
Total Households: