Office Space
960b Harvest Drive Blue Bell, PA 19422
960b Harvest Drive Blue Bell, PA 19422
Details & Description
Property Highlights
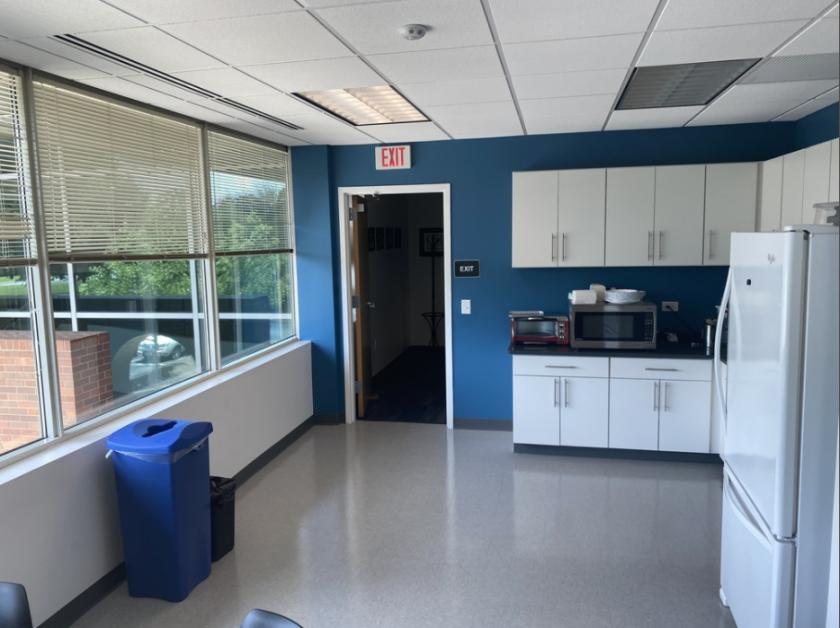
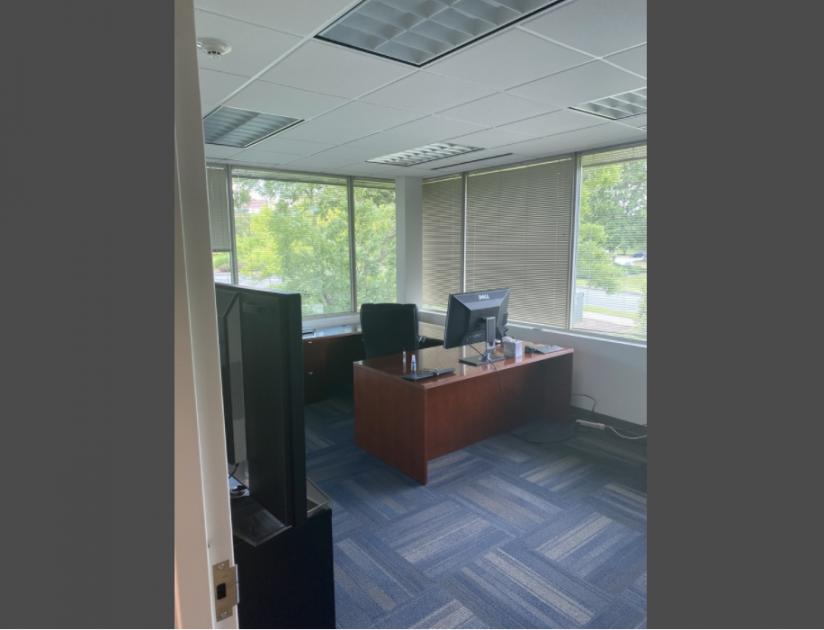
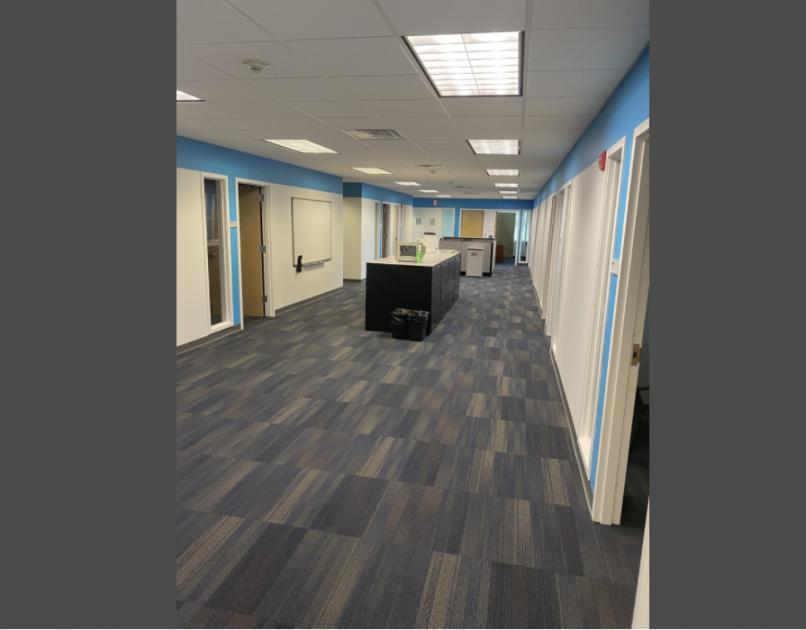
• Functional and Elegant Fit-out including Window-lined Offices, Kitchen, Reception, Conference room, Bullpen
• Ownership has completed Sleek and Modern Renovations on Common Areas and added Brand-new Fitness Center
Listing Agents

Matthew Devine
O: 215-646-2900
M: 610-291-4400
mdevine@kwcommercial.com
O: 215-646-2900
M: 610-291-4400
mdevine@kwcommercial.com
While we strive to provide the most accurate information, all listing information, and demographic data, is provided by third-parties. As such, MyEListing will not be responsible for the accuracy of the information. It is strongly recommended that you verify all information with the listing agent, and any relevant agencies, prior to making any decisions.