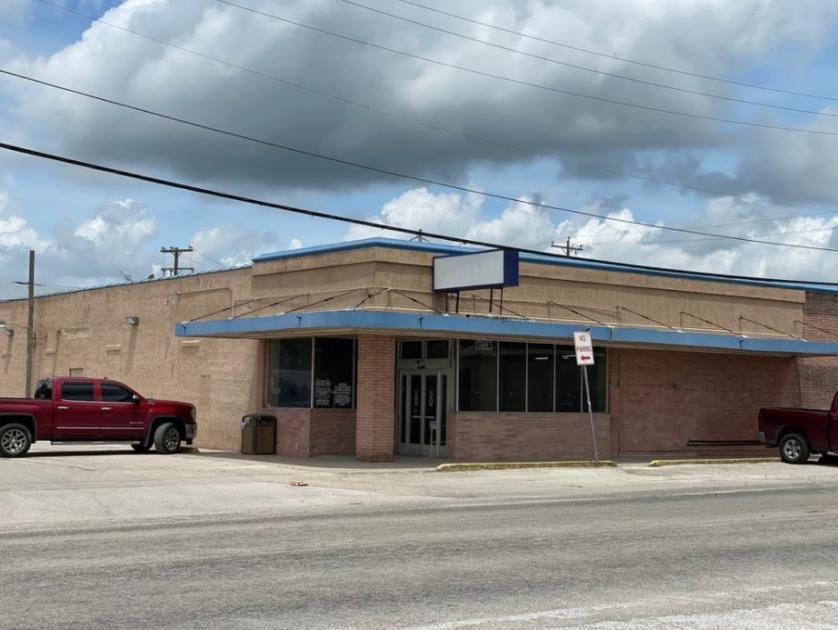
1-Mile | 3-Miles | 5-Miles | ||
---|---|---|---|---|
Total Population | 635 | 4,508 | 16,790 | |
Population Median Age | 42 | 41 | 38 | |
Population by Age | 0-9 Yrs | 69 (10%) | 448 (9%) | 1973 (11%) |
10-19 Yrs | 90 (14%) | 594 (13%) | 2450 (14%) | |
20-29 Yrs | 57 (8%) | 470 (10%) | 1913 (11%) | |
30-39 Yrs | 61 (9%) | 529 (11%) | 2241 (13%) | |
40-49 Yrs | 95 (14%) | 710 (15%) | 2579 (15%) | |
50-59 Yrs | 97 (15%) | 711 (15%) | 2239 (13%) | |
60-69 Yrs | 72 (11%) | 522 (11%) | 1902 (11%) | |
70+ Yrs | 94 (14%) | 524 (11%) | 1492 (8%) | |
Median HH Income | $50,923 | $68,974 | $78,756 | |
Total Household Income | < 24K | 46 (19%) | 245 (15%) | 725 (12%) |
25-49K | 72 (30%) | 360 (22%) | 964 (17%) | |
50-74K | 33 (13%) | 261 (16%) | 965 (17%) | |
75-99K | 35 (14%) | 281 (17%) | 932 (16%) | |
100-199K | 42 (17%) | 362 (22%) | 1680 (30%) | |
200K+ | 10 (4%) | 96 (5%) | 322 (5%) | |
Highest Education Level | No Diploma | 93 | 449 | 1192 |
Diploma or GED | 157 | 1128 | 3670 | |
Some College | 99 | 749 | 2785 | |
Assoc. Degree | 40 | 375 | 1354 | |
Bachelors Degree | 50 | 385 | 1689 | |
Higher Degree | 16 | 166 | 848 | |
Total Housing Units | 260 | 1,696 | 5,933 | |
--Owner-Occupied | 186 | 1,331 | 4,619 | |
--Renter-Occupied | 52 | 274 | 969 | |
Owner-Occupied Values | < 100K | 76 | 451 | 1147 |
100-199K | 47 | 353 | 1413 | |
200-299K | 28 | 209 | 1143 | |
300-399K | 21 | 160 | 475 | |
400-499K | 6 | 88 | 231 | |
500K+ | 8 | 71 | 211 | |
Total Working Age Population | 525 | 3,710 | 13,324 | |
In Work Force | 280 | 2,261 | 8,403 | |
Not In Work Force | 244 | 1,449 | 4,921 | |
Workforce Employed | 266 | 2,168 | 7,959 | |
Workforce Unemployed | 11 | 67 | 276 | |
Civlian Workforce | 277 | 2,235 | 8,235 | |
Military Workforce | 4 | 26 | 168 | |
Total Households | 238 | 1,605 | 5,588 | |
Family Households | 162 | 1,170 | 4,279 | |
Non-Family Households | 76 | 436 | 1,309 | |
Married Couple | 121 | 913 | 3,438 | |
Other Family | 42 | 256 | 840 | |
Married w/Child | 43 | 324 | 1,487 | |
Single Male w/Child | 3 | 12 | 68 | |
Single Female w/Child | 22 | 106 | 293 |
Population Change Last Two Decades - Plus Projection
2000 | % | 2010 | % | 2020 | % | 2030 | |
---|---|---|---|---|---|---|---|
Texas | 20,851,820 | +21 | 25,145,561 | +18 | 29,677,668 | +18 | 34,894,452 |
Bexar County | 1,392,931 | +23 | 1,714,773 | +22 | 2,093,502 | +20 | 2,502,617 |
Comal County | 78,021 | +39 | 108,472 | +36 | 147,330 | +39 | 204,873 |
Guadalupe County | 89,023 | +48 | 131,533 | +29 | 170,266 | +30 | 221,353 |
Total Working Age Population:
Total Households:
Total Working Age Population:
Total Households:
Total Working Age Population:
Total Households: