Retail Space
3660 Southwest Military Drive San Antonio, TX 78211
3660 Southwest Military Drive San Antonio, TX 78211

Details & Description
Property Highlights
• High traffic count located off the corner of SW Military Drive and Bynum Ave.
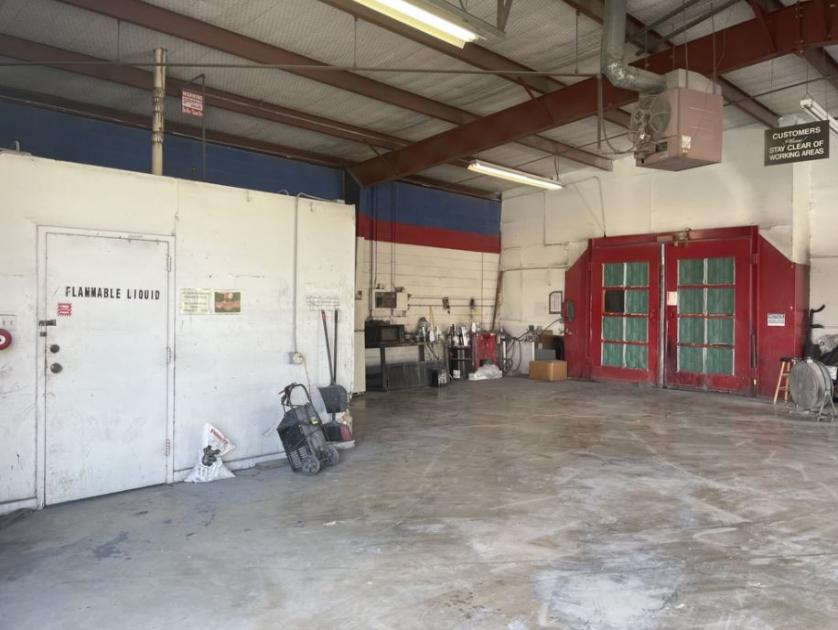
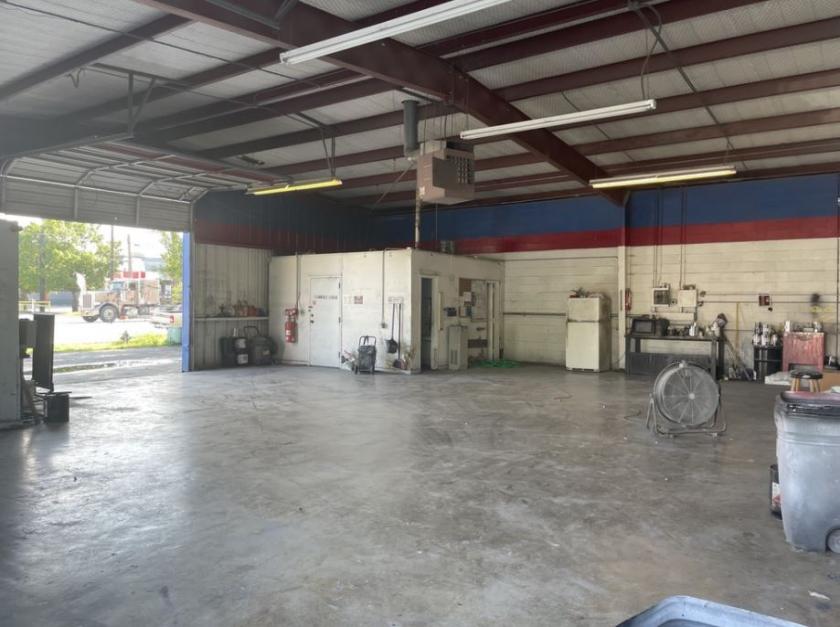
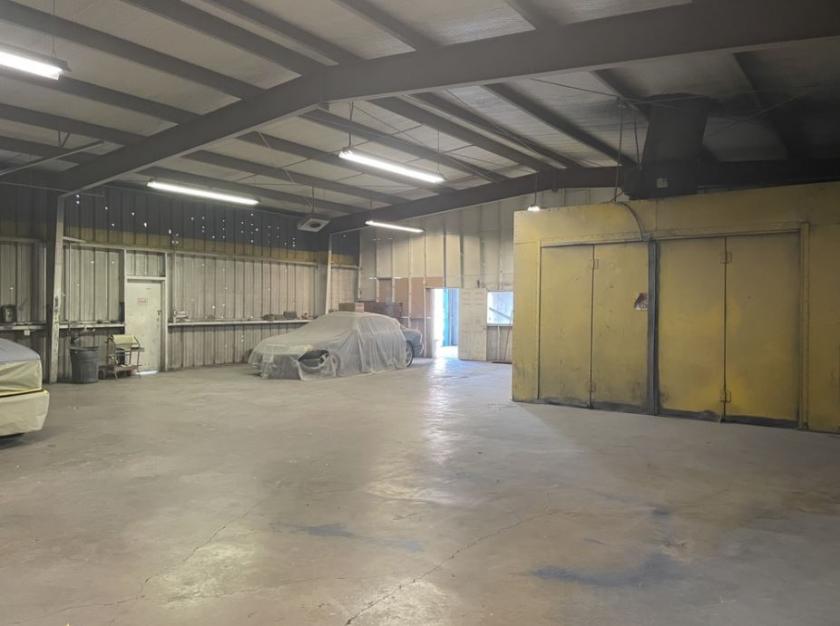
• Ample clear height and grade level roll-up doors to accommodate most uses.
Additional Photos
Listing Agents

Will Curtis
O: 210-201-5444
will@crossedsaberscre.com
O: 210-201-5444
will@crossedsaberscre.com
While we strive to provide the most accurate information, all listing information, and demographic data, is provided by third-parties. As such, MyEListing will not be responsible for the accuracy of the information. It is strongly recommended that you verify all information with the listing agent, and any relevant agencies, prior to making any decisions.


