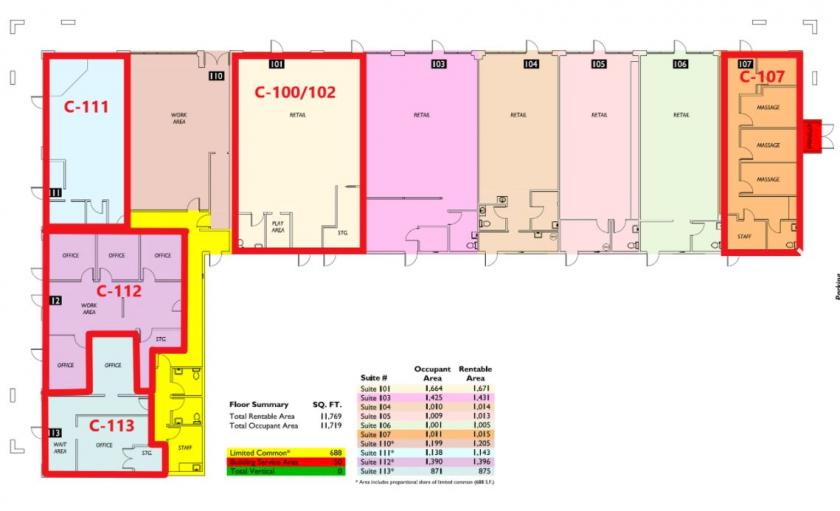
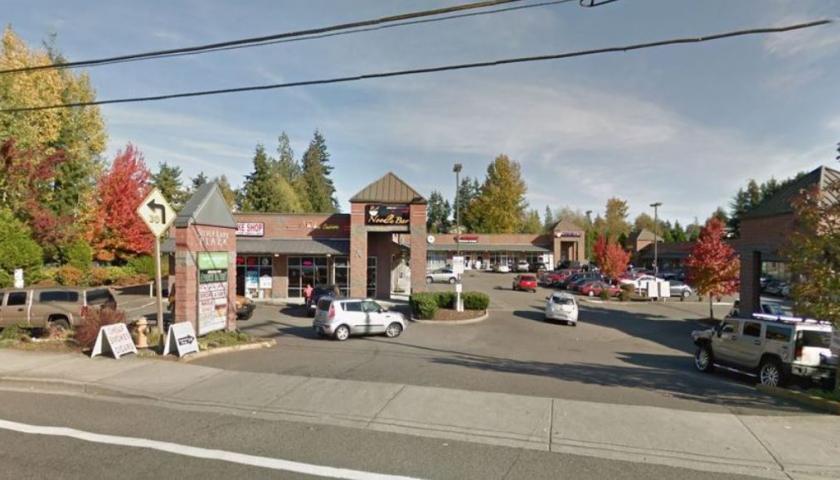
1-Mile | 3-Miles | 5-Miles | ||
---|---|---|---|---|
Total Population | 19,313 | 136,578 | 269,853 | |
Population Median Age | 37 | 37 | 36 | |
Population by Age | 0-9 Yrs | 2402 (12%) | 18067 (13%) | 35654 (13%) |
10-19 Yrs | 2450 (12%) | 17291 (12%) | 35248 (13%) | |
20-29 Yrs | 2979 (15%) | 19863 (14%) | 38440 (14%) | |
30-39 Yrs | 3095 (16%) | 22241 (16%) | 43723 (16%) | |
40-49 Yrs | 2342 (12%) | 18334 (13%) | 37367 (13%) | |
50-59 Yrs | 2228 (11%) | 17337 (12%) | 34762 (12%) | |
60-69 Yrs | 2170 (11%) | 12799 (9%) | 25841 (9%) | |
70+ Yrs | 1648 (8%) | 10646 (7%) | 18820 (6%) | |
Median HH Income | $83,787 | $80,317 | $85,250 | |
Total Household Income | < 24K | 969 (13%) | 6114 (11%) | 10683 (10%) |
25-49K | 1156 (16%) | 8798 (17%) | 16117 (16%) | |
50-74K | 1015 (14%) | 8863 (17%) | 16640 (16%) | |
75-99K | 1230 (17%) | 8107 (15%) | 14847 (14%) | |
100-199K | 2386 (33%) | 15219 (29%) | 31600 (31%) | |
200K+ | 388 (5%) | 3898 (7%) | 9168 (9%) | |
Highest Education Level | No Diploma | 1279 | 9155 | 16165 |
Diploma or GED | 2682 | 21020 | 39077 | |
Some College | 3341 | 22877 | 43456 | |
Assoc. Degree | 1292 | 9694 | 18843 | |
Bachelors Degree | 3161 | 20880 | 44023 | |
Higher Degree | 1308 | 8525 | 20245 | |
Total Housing Units | 7,470 | 53,518 | 103,838 | |
--Owner-Occupied | 4,430 | 29,544 | 59,525 | |
--Renter-Occupied | 2,715 | 21,456 | 39,531 | |
Owner-Occupied Values | < 100K | 233 | 1725 | 2887 |
100-199K | 197 | 2127 | 3404 | |
200-299K | 547 | 4811 | 7856 | |
300-399K | 1496 | 7117 | 14077 | |
400-499K | 1185 | 6846 | 13062 | |
500K+ | 771 | 6919 | 18239 | |
Total Working Age Population | 15,658 | 107,845 | 212,085 | |
In Work Force | 10,378 | 75,600 | 149,224 | |
Not In Work Force | 5,280 | 32,245 | 62,861 | |
Workforce Employed | 9,737 | 71,734 | 142,135 | |
Workforce Unemployed | 514 | 3,339 | 6,174 | |
Civlian Workforce | 10,250 | 75,074 | 148,310 | |
Military Workforce | 128 | 526 | 914 | |
Total Households | 7,145 | 51,000 | 99,055 | |
Family Households | 4,942 | 33,936 | 67,503 | |
Non-Family Households | 2,203 | 17,064 | 31,552 | |
Married Couple | 3,730 | 24,838 | 50,774 | |
Other Family | 1,212 | 9,099 | 16,729 | |
Married w/Child | 1,556 | 11,478 | 24,212 | |
Single Male w/Child | 211 | 1,995 | 3,381 | |
Single Female w/Child | 473 | 3,229 | 5,849 |
Population Change Last Two Decades - Plus Projection
2000 | % | 2010 | % | 2020 | % | 2030 | |
---|---|---|---|---|---|---|---|
Washington | 5,894,121 | +14 | 6,724,540 | +14 | 7,638,415 | +11 | 8,503,178 |
Snohomish County | 606,024 | +18 | 713,335 | +18 | 841,998 | +14 | 955,910 |
Total Working Age Population:
Total Households:
Total Working Age Population:
Total Households:
Total Working Age Population:
Total Households: