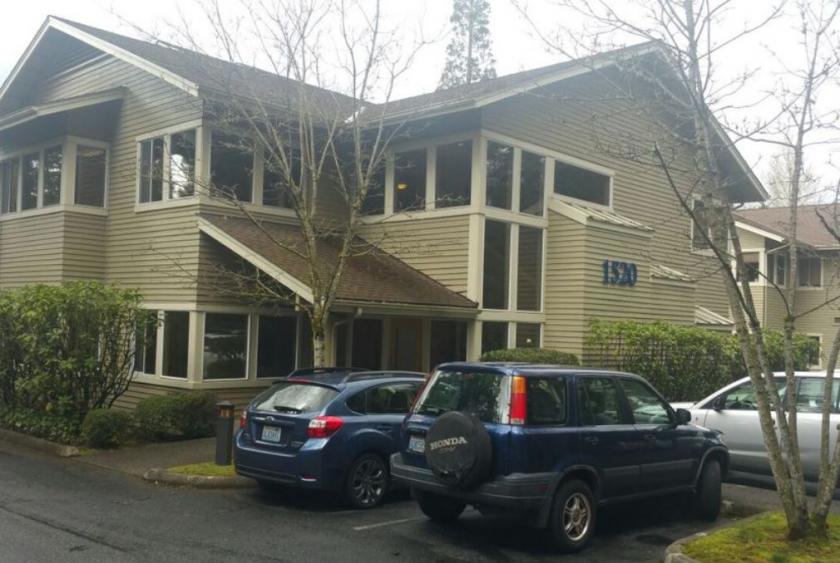
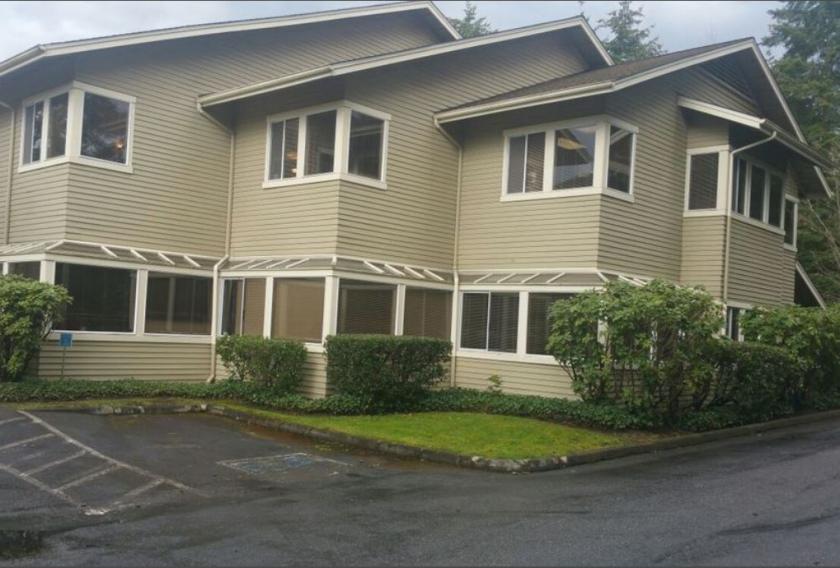
Office Space
1530 140th Avenue Northeast Bellevue, WA 98005
1530 140th Avenue Northeast Bellevue, WA 98005
Details & Description
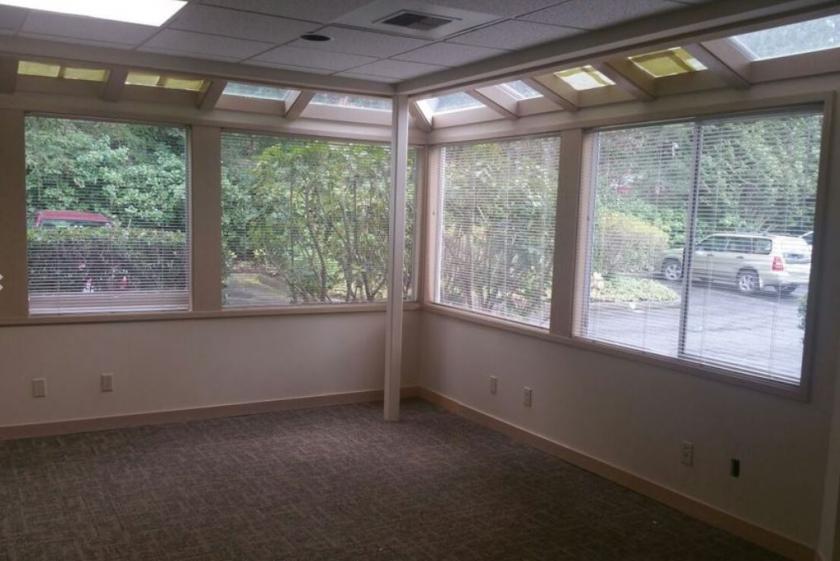
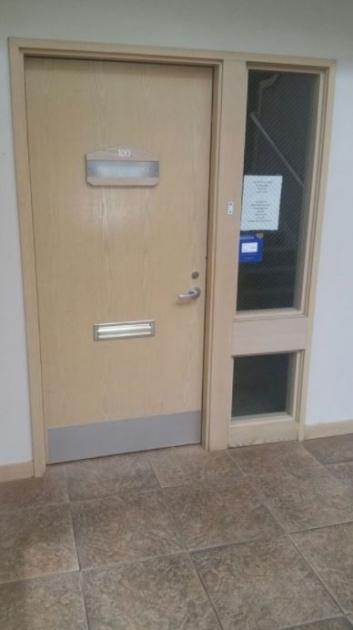
Additional Photos
Listing Agents

Michael Armanious
O: 253-460-8640
M: 253-988-6115
marmanious@kw.com
O: 253-460-8640
M: 253-988-6115
marmanious@kw.com
While we strive to provide the most accurate information, all listing information, and demographic data, is provided by third-parties. As such, MyEListing will not be responsible for the accuracy of the information. It is strongly recommended that you verify all information with the listing agent, and any relevant agencies, prior to making any decisions.


