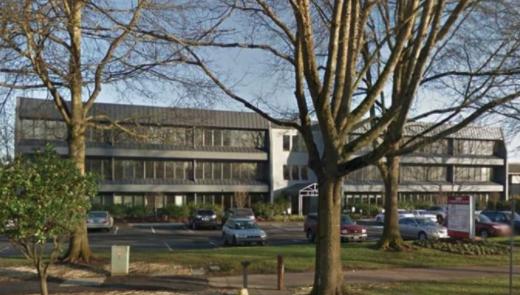
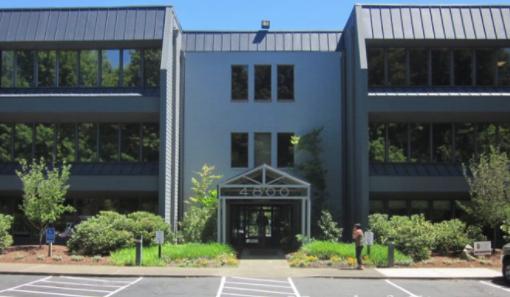
1-Mile | 3-Miles | 5-Miles | ||
---|---|---|---|---|
Total Population | 16,673 | 137,204 | 358,521 | |
Population Median Age | 37 | 39 | 38 | |
Population by Age | 0-9 Yrs | 2264 (13%) | 15649 (11%) | 42694 (11%) |
10-19 Yrs | 1734 (10%) | 14723 (10%) | 43509 (12%) | |
20-29 Yrs | 2647 (15%) | 20313 (14%) | 47349 (13%) | |
30-39 Yrs | 3035 (18%) | 22219 (16%) | 56549 (15%) | |
40-49 Yrs | 2142 (12%) | 18593 (13%) | 51540 (14%) | |
50-59 Yrs | 2027 (12%) | 17552 (12%) | 46278 (12%) | |
60-69 Yrs | 1462 (8%) | 15411 (11%) | 39783 (11%) | |
70+ Yrs | 1362 (8%) | 12744 (9%) | 30819 (8%) | |
Median HH Income | $50,246 | $72,382 | $84,217 | |
Total Household Income | < 24K | 1542 (22%) | 8061 (14%) | 16837 (12%) |
25-49K | 1797 (26%) | 11418 (20%) | 23719 (16%) | |
50-74K | 1180 (17%) | 9524 (16%) | 22065 (15%) | |
75-99K | 834 (12%) | 7506 (13%) | 19375 (13%) | |
100-199K | 1073 (16%) | 14654 (26%) | 39608 (28%) | |
200K+ | 280 (4%) | 4984 (8%) | 17926 (12%) | |
Highest Education Level | No Diploma | 2375 | 8070 | 16194 |
Diploma or GED | 2263 | 15603 | 36809 | |
Some College | 2375 | 20121 | 49414 | |
Assoc. Degree | 897 | 8281 | 20898 | |
Bachelors Degree | 2378 | 29312 | 77565 | |
Higher Degree | 1036 | 16786 | 51180 | |
Total Housing Units | 6,986 | 58,613 | 146,073 | |
--Owner-Occupied | 2,256 | 29,609 | 86,050 | |
--Renter-Occupied | 4,450 | 26,539 | 53,480 | |
Owner-Occupied Values | < 100K | 328 | 851 | 1919 |
100-199K | 190 | 1744 | 3732 | |
200-299K | 430 | 4108 | 12218 | |
300-399K | 721 | 8394 | 21110 | |
400-499K | 310 | 6257 | 17937 | |
500K+ | 278 | 8256 | 29134 | |
Total Working Age Population | 13,340 | 112,250 | 287,908 | |
In Work Force | 9,458 | 79,474 | 202,036 | |
Not In Work Force | 3,881 | 32,775 | 85,872 | |
Workforce Employed | 8,720 | 75,146 | 192,844 | |
Workforce Unemployed | 581 | 4,060 | 8,884 | |
Civlian Workforce | 9,302 | 79,205 | 201,727 | |
Military Workforce | 157 | 269 | 309 | |
Total Households | 6,706 | 56,148 | 139,530 | |
Family Households | 3,456 | 32,849 | 89,939 | |
Non-Family Households | 3,250 | 23,299 | 49,591 | |
Married Couple | 2,260 | 25,290 | 71,160 | |
Other Family | 1,196 | 7,559 | 18,779 | |
Married w/Child | 927 | 10,364 | 31,009 | |
Single Male w/Child | 165 | 970 | 2,767 | |
Single Female w/Child | 582 | 2,863 | 7,276 |
Population Change Last Two Decades - Plus Projection
2000 | % | 2010 | % | 2020 | % | 2030 | |
---|---|---|---|---|---|---|---|
Oregon | 3,421,399 | +12 | 3,831,074 | +11 | 4,264,810 | +11 | 4,727,438 |
Clackamas County | 338,391 | +11 | 375,992 | +14 | 428,860 | +14 | 490,011 |
Multnomah County | 660,486 | +11 | 735,334 | +12 | 822,675 | +10 | 906,904 |
Washington County | 445,342 | +19 | 529,710 | +17 | 619,337 | +16 | 718,633 |
Yamhill County | 84,992 | +17 | 99,193 | +12 | 111,101 | +15 | 127,404 |
Washington | 5,894,121 | +14 | 6,724,540 | +14 | 7,638,415 | +11 | 8,503,178 |
Clark County | 345,238 | +23 | 425,363 | +17 | 499,400 | +16 | 576,879 |
Total Working Age Population:
Total Households:
Total Working Age Population:
Total Households:
Total Working Age Population:
Total Households: