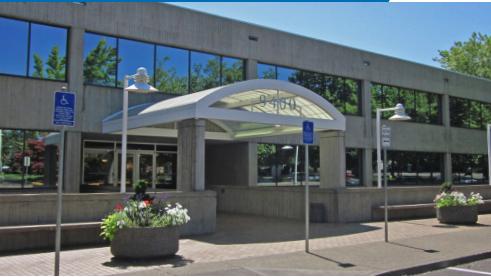
Office Space
9400 Southwest Beaverton Hillsdale Highway Beaverton, OR 97005
9400 Southwest Beaverton Hillsdale Highway Beaverton, OR 97005
Details & Description
Property Highlights
- • Courtyard setting elevator served
- • Professionally managed
- • Ample parking with 3.51000 ratio
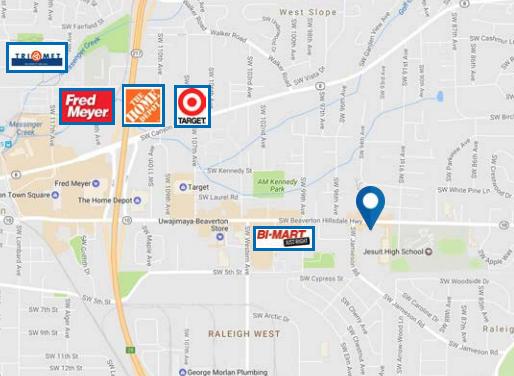
- • Along SW Beaverton Hillsdale Highway
- • Adjacent to Jesuit High School
- • Walk to amenities close to Beaverton Town Square
Listing Agents

Duane Link
O: 503-225-8465
duanel@norris-stevens.com
O: 503-225-8465
duanel@norris-stevens.com
While we strive to provide the most accurate information, all listing information, and demographic data, is provided by third-parties. As such, MyEListing will not be responsible for the accuracy of the information. It is strongly recommended that you verify all information with the listing agent, and any relevant agencies, prior to making any decisions.