Industrial Properties
1615 Foulkrod Street Philadelphia, PA 19124
1615 Foulkrod Street Philadelphia, PA 19124
Details & Description
Property Highlights
- • RM-1 zoning
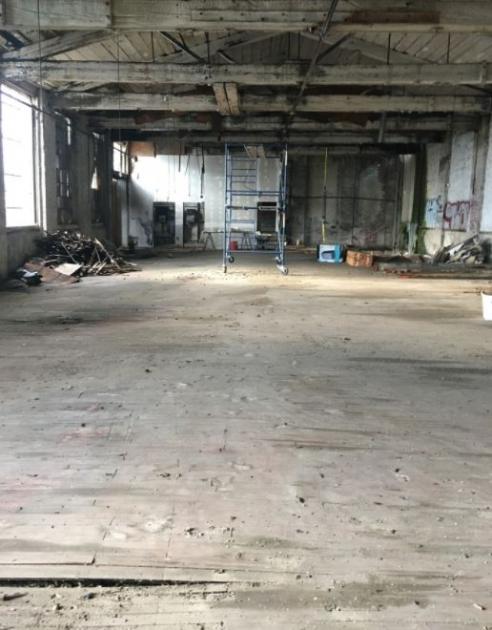
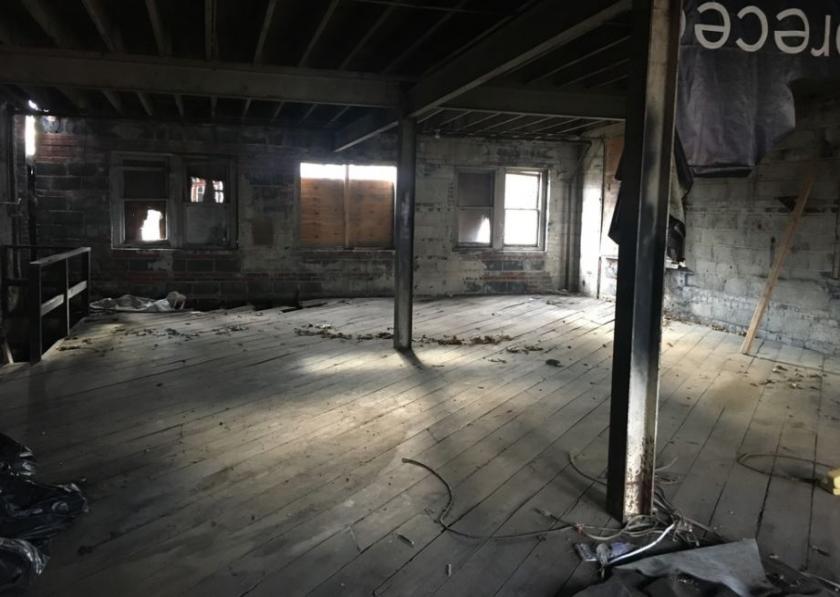
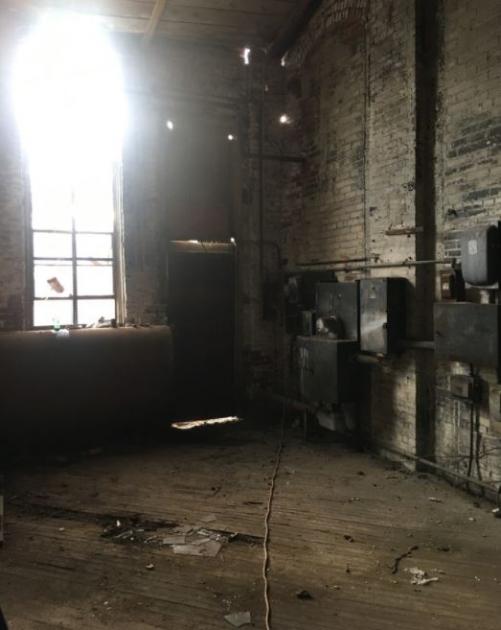
- • Warehouse
- • Opportunity Zone
- • Frankford Avenue
Additional Photos

Listing Agents

Mark Andrade
KW Commercial
O: 646-797-1816
M: 267-238-5735
mark.andrade@kw.com
KW Commercial
O: 646-797-1816
M: 267-238-5735
mark.andrade@kw.com
While we strive to provide the most accurate information, all listing information, and demographic data, is provided by third-parties. As such, MyEListing will not be responsible for the accuracy of the information. It is strongly recommended that you verify all information with the listing agent, and any relevant agencies, prior to making any decisions.


