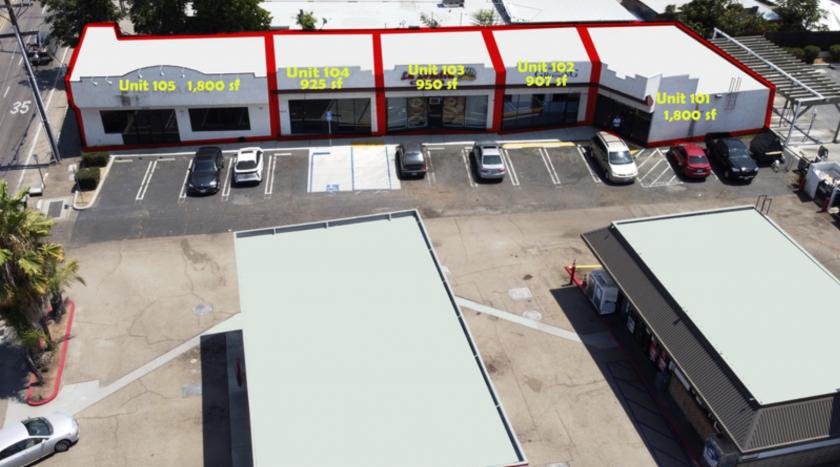
1-Mile | 3-Miles | 5-Miles | ||
---|---|---|---|---|
Total Population | 14,141 | 91,903 | 209,412 | |
Population Median Age | 38 | 39 | 38 | |
Population by Age | 0-9 Yrs | 2059 (14%) | 11613 (12%) | 27784 (13%) |
10-19 Yrs | 1588 (11%) | 11562 (12%) | 26407 (12%) | |
20-29 Yrs | 1980 (14%) | 12254 (13%) | 31262 (14%) | |
30-39 Yrs | 2038 (14%) | 12957 (14%) | 29412 (14%) | |
40-49 Yrs | 1908 (13%) | 11855 (12%) | 26012 (12%) | |
50-59 Yrs | 1589 (11%) | 12044 (13%) | 27047 (12%) | |
60-69 Yrs | 1639 (11%) | 10804 (11%) | 22875 (10%) | |
70+ Yrs | 1340 (9%) | 8814 (9%) | 18613 (8%) | |
Median HH Income | $62,028 | $78,953 | $68,779 | |
Total Household Income | < 24K | 960 (19%) | 3996 (13%) | 11476 (16%) |
25-49K | 895 (18%) | 5026 (16%) | 13512 (19%) | |
50-74K | 1126 (22%) | 5242 (17%) | 11827 (17%) | |
75-99K | 725 (14%) | 4743 (15%) | 9609 (14%) | |
100-199K | 997 (20%) | 8623 (28%) | 17072 (25%) | |
200K+ | 248 (5%) | 2399 (7%) | 4560 (6%) | |
Highest Education Level | No Diploma | 1066 | 5351 | 16181 |
Diploma or GED | 3075 | 18748 | 40326 | |
Some College | 2646 | 18284 | 39803 | |
Assoc. Degree | 1096 | 6339 | 13034 | |
Bachelors Degree | 1167 | 10051 | 22472 | |
Higher Degree | 473 | 4182 | 9154 | |
Total Housing Units | 5,251 | 31,363 | 70,981 | |
--Owner-Occupied | 2,226 | 19,840 | 37,795 | |
--Renter-Occupied | 2,726 | 10,188 | 30,262 | |
Owner-Occupied Values | < 100K | 199 | 2668 | 4765 |
100-199K | 282 | 1082 | 1836 | |
200-299K | 161 | 1392 | 2470 | |
300-399K | 253 | 2347 | 4949 | |
400-499K | 613 | 5179 | 9985 | |
500K+ | 718 | 7173 | 13791 | |
Total Working Age Population | 11,170 | 73,462 | 165,806 | |
In Work Force | 7,118 | 47,287 | 105,858 | |
Not In Work Force | 4,052 | 26,175 | 59,948 | |
Workforce Employed | 6,436 | 43,626 | 97,246 | |
Workforce Unemployed | 434 | 2,762 | 7,021 | |
Civlian Workforce | 6,870 | 46,387 | 104,268 | |
Military Workforce | 248 | 900 | 1,591 | |
Total Households | 4,952 | 30,028 | 68,057 | |
Family Households | 3,321 | 21,980 | 49,186 | |
Non-Family Households | 1,631 | 8,048 | 18,872 | |
Married Couple | 2,433 | 16,532 | 35,624 | |
Other Family | 888 | 5,448 | 13,562 | |
Married w/Child | 1,140 | 6,860 | 15,880 | |
Single Male w/Child | 170 | 672 | 1,621 | |
Single Female w/Child | 277 | 1,682 | 4,627 |
Population Change Last Two Decades - Plus Projection
2000 | % | 2010 | % | 2020 | % | 2030 | |
---|---|---|---|---|---|---|---|
California | 33,871,648 | +10 | 37,253,956 | +9 | 40,467,295 | +8 | 43,631,295 |
San Diego County | 2,813,833 | +10 | 3,095,313 | +10 | 3,390,529 | +6 | 3,608,286 |
Total Working Age Population:
Total Households:
Total Working Age Population:
Total Households:
Total Working Age Population:
Total Households: