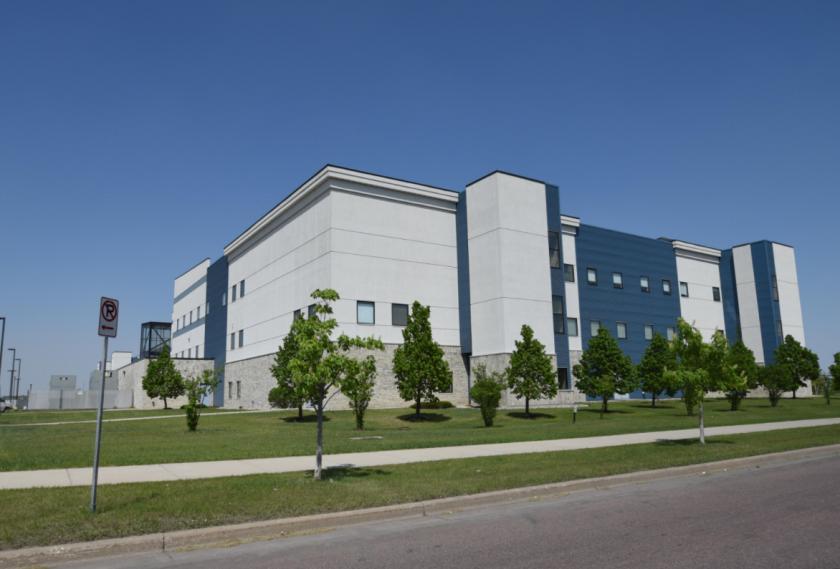
Office Space
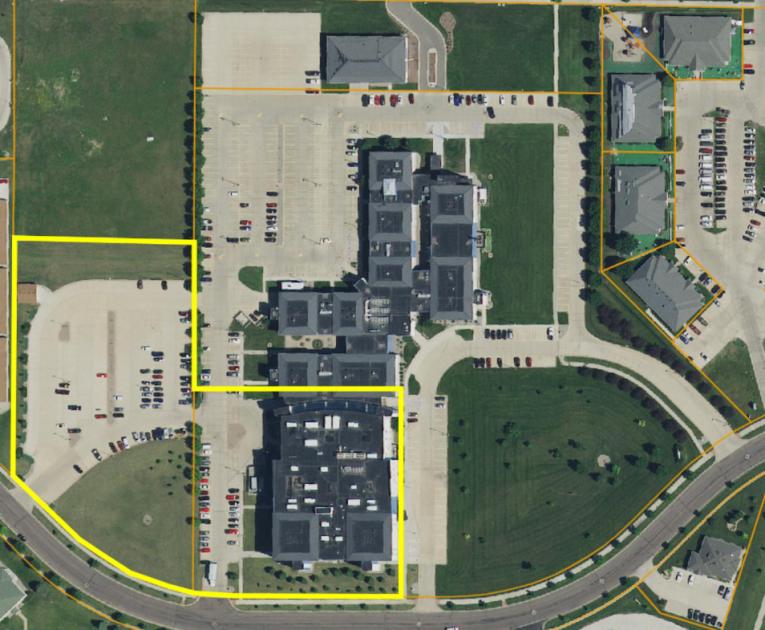
4837 Amber Valley Parkway South Fargo, ND 58104
4837 Amber Valley Parkway South Fargo, ND 58104
Details & Description
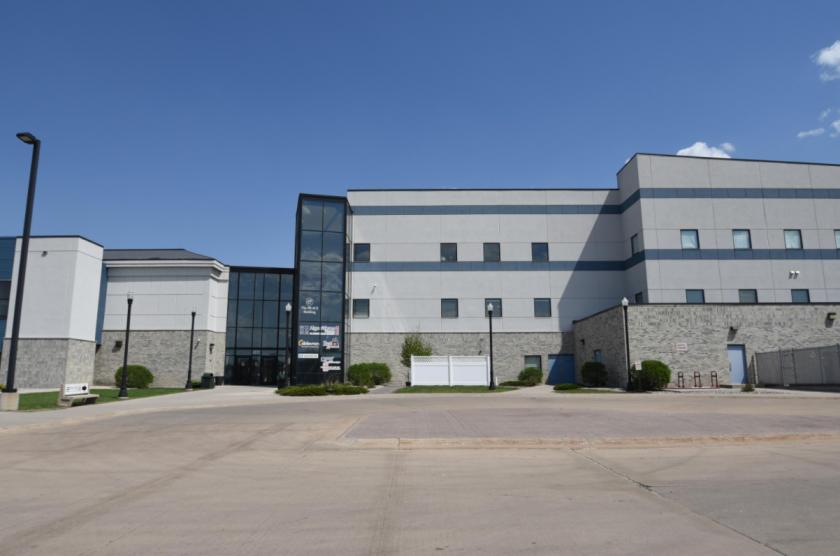
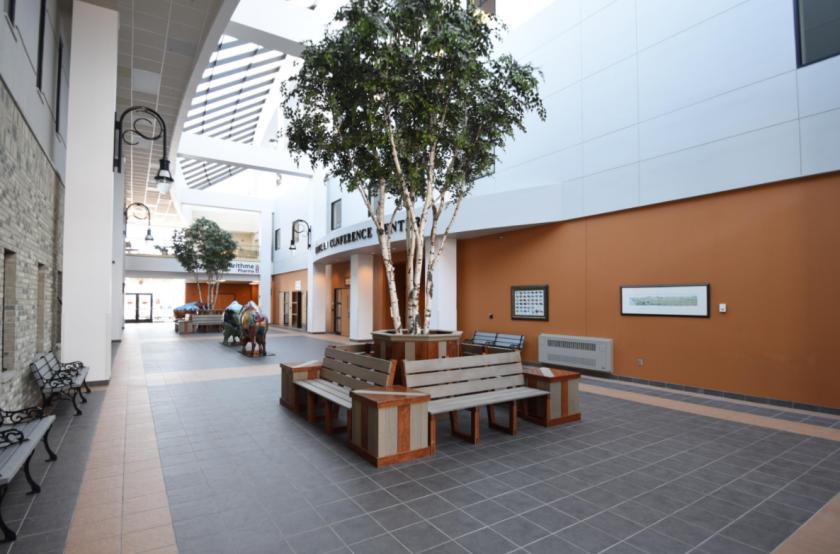
Additional Photos

Listing Agents

Andy Westby
O: 701-239-5839
andy.westby@goldmark.com
O: 701-239-5839
andy.westby@goldmark.com
While we strive to provide the most accurate information, all listing information, and demographic data, is provided by third-parties. As such, MyEListing will not be responsible for the accuracy of the information. It is strongly recommended that you verify all information with the listing agent, and any relevant agencies, prior to making any decisions.


