Office Space
1224 North Shartel Avenue Oklahoma City, OK 73103
1224 North Shartel Avenue Oklahoma City, OK 73103
Details & Description
Property Highlights
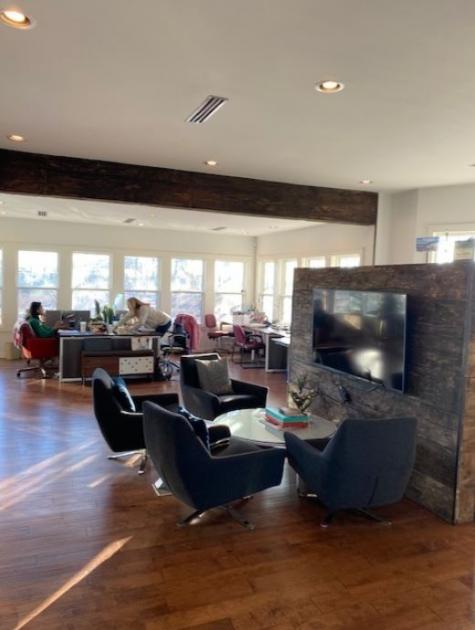
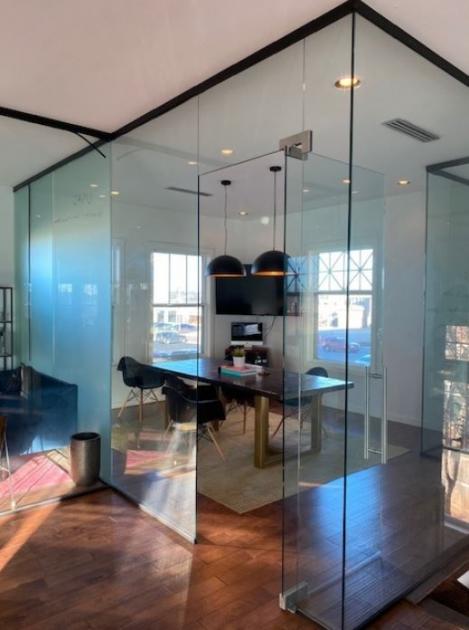
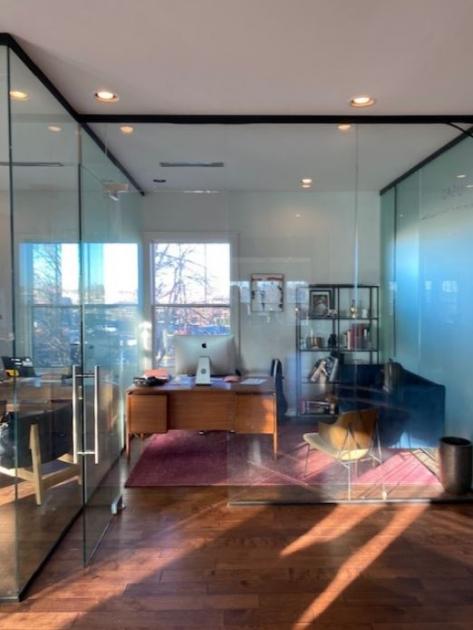
- • 6-8 Offices
- • Reception Area
- • Breakroom Break Bar
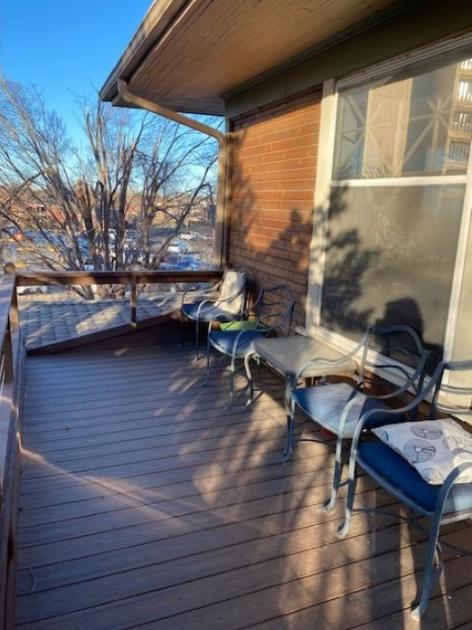
- • Patio Deck
- • Sun Room or small office
Additional Photos
Listing Agents

Monica Ann
O: 405-701-3505
M: 405-408-0890
monica@pegasusok.com
O: 405-701-3505
M: 405-408-0890
monica@pegasusok.com
While we strive to provide the most accurate information, all listing information, and demographic data, is provided by third-parties. As such, MyEListing will not be responsible for the accuracy of the information. It is strongly recommended that you verify all information with the listing agent, and any relevant agencies, prior to making any decisions.


