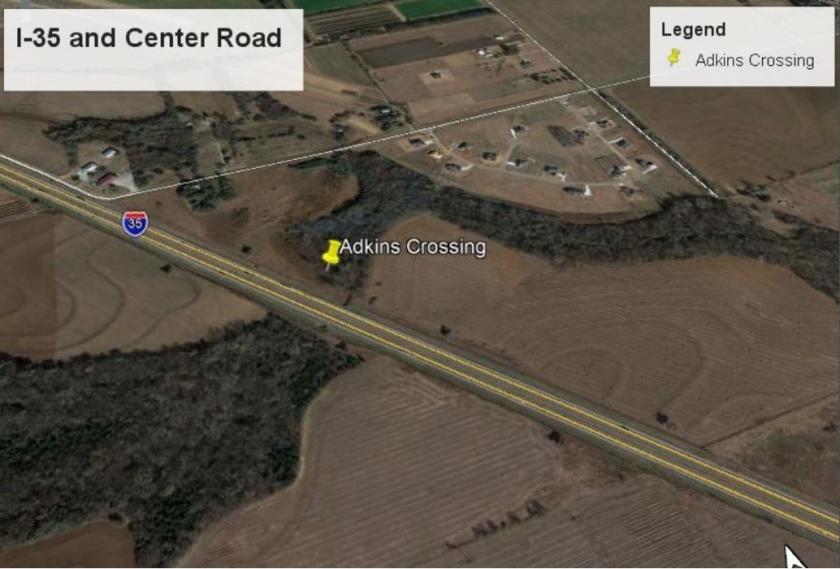
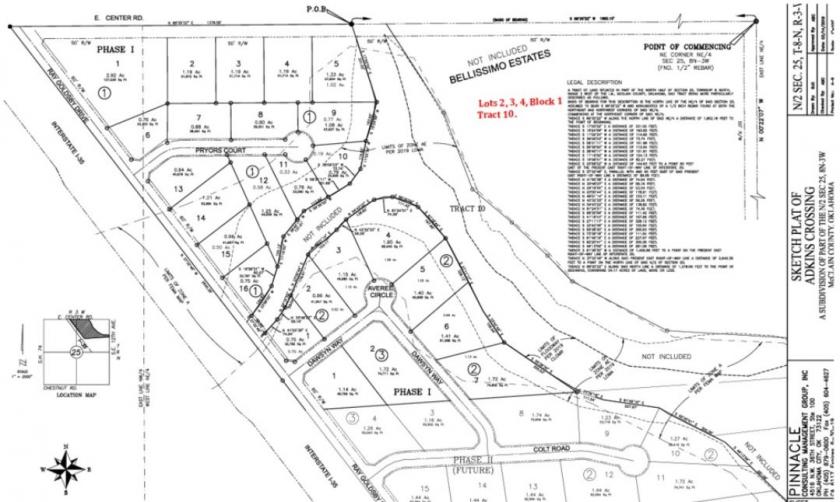
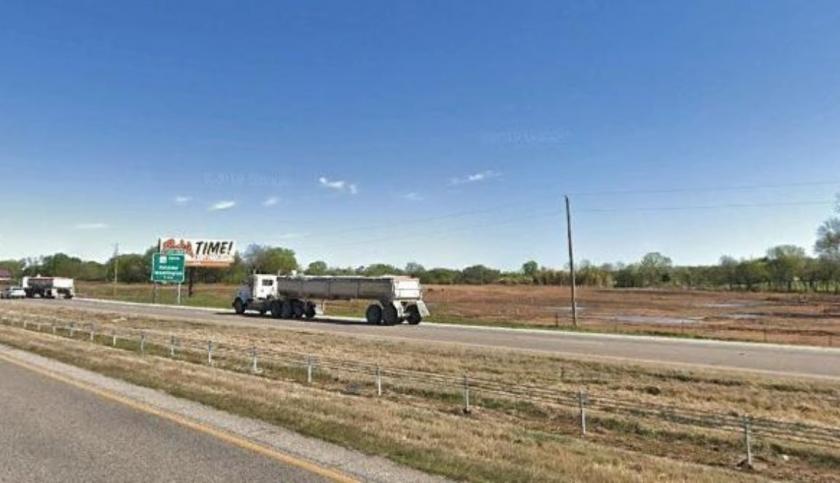
1-Mile | 3-Miles | 5-Miles | ||
---|---|---|---|---|
Total Population | 195 | 5,884 | 47,992 | |
Population Median Age | 39 | 36 | 32 | |
Population by Age | 0-9 Yrs | 31 (15%) | 696 (11%) | 4062 (8%) |
10-19 Yrs | 21 (10%) | 607 (10%) | 9399 (19%) | |
20-29 Yrs | 21 (10%) | 1583 (26%) | 15509 (32%) | |
30-39 Yrs | 22 (11%) | 871 (14%) | 5720 (11%) | |
40-49 Yrs | 25 (12%) | 510 (8%) | 3482 (7%) | |
50-59 Yrs | 30 (15%) | 613 (10%) | 3285 (6%) | |
60-69 Yrs | 31 (15%) | 427 (7%) | 3313 (6%) | |
70+ Yrs | 15 (7%) | 577 (9%) | 3221 (6%) | |
Median HH Income | $75,710 | $59,587 | $48,021 | |
Total Household Income | < 24K | 9 (13%) | 468 (19%) | 4430 (25%) |
25-49K | 13 (19%) | 534 (22%) | 4494 (25%) | |
50-74K | 12 (17%) | 500 (20%) | 3524 (20%) | |
75-99K | 13 (19%) | 363 (15%) | 1693 (9%) | |
100-199K | 19 (27%) | 453 (18%) | 2542 (14%) | |
200K+ | 3 (4%) | 101 (4%) | 636 (3%) | |
Highest Education Level | No Diploma | 11 | 128 | 1608 |
Diploma or GED | 40 | 742 | 4704 | |
Some College | 33 | 934 | 5668 | |
Assoc. Degree | 11 | 353 | 1869 | |
Bachelors Degree | 25 | 904 | 5519 | |
Higher Degree | 10 | 536 | 4268 | |
Total Housing Units | 73 | 2,679 | 19,668 | |
--Owner-Occupied | 58 | 1,307 | 6,778 | |
--Renter-Occupied | 9 | 1,113 | 10,541 | |
Owner-Occupied Values | < 100K | 8 | 121 | 1027 |
100-199K | 25 | 661 | 3208 | |
200-299K | 12 | 258 | 1321 | |
300-399K | 9 | 175 | 652 | |
400-499K | 2 | 47 | 284 | |
500K+ | 3 | 46 | 286 | |
Total Working Age Population | 151 | 4,803 | 41,408 | |
In Work Force | 100 | 3,191 | 25,979 | |
Not In Work Force | 50 | 1,612 | 15,429 | |
Workforce Employed | 97 | 3,081 | 24,300 | |
Workforce Unemployed | 3 | 107 | 1,579 | |
Civlian Workforce | 100 | 3,188 | 25,879 | |
Military Workforce | 0 | 3 | 100 | |
Total Households | 68 | 2,420 | 17,319 | |
Family Households | 56 | 1,376 | 8,902 | |
Non-Family Households | 12 | 1,044 | 8,418 | |
Married Couple | 47 | 1,138 | 6,265 | |
Other Family | 9 | 239 | 2,637 | |
Married w/Child | 20 | 543 | 2,656 | |
Single Male w/Child | 1 | 50 | 407 | |
Single Female w/Child | 3 | 84 | 980 |
Population Change Last Two Decades - Plus Projection
2000 | % | 2010 | % | 2020 | % | 2030 | |
---|---|---|---|---|---|---|---|
Oklahoma | 3,450,654 | +9 | 3,751,351 | +7 | 4,024,202 | +7 | 4,302,501 |
Cleveland County | 208,016 | +23 | 255,755 | +15 | 294,868 | +14 | 336,050 |
McClain County | 27,740 | +24 | 34,506 | +12 | 38,671 | +11 | 42,858 |
Total Working Age Population:
Total Households:
Total Working Age Population:
Total Households:
Total Working Age Population:
Total Households: