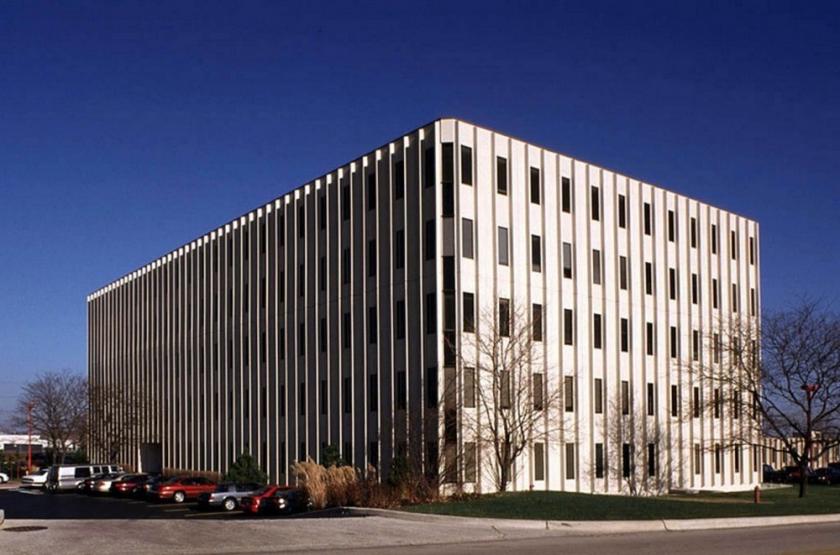
Office Space
920 Davis Road Elgin, IL 60123
920 Davis Road Elgin, IL 60123
Details & Description
Property Highlights
- • Signage on building facing I-90 available
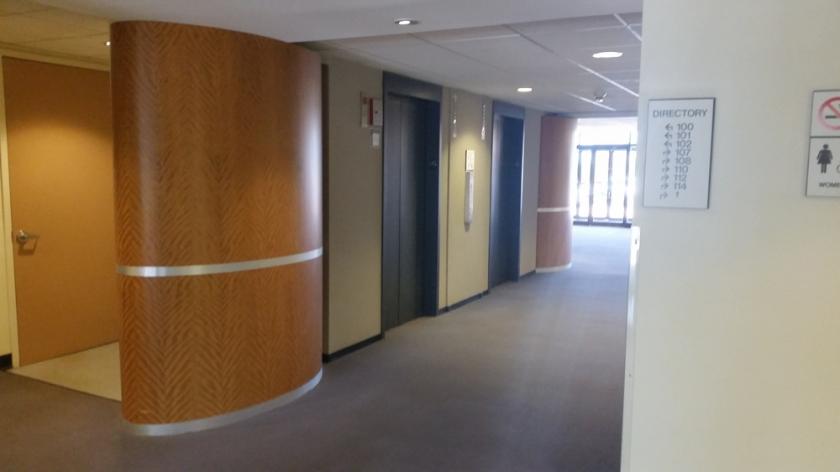
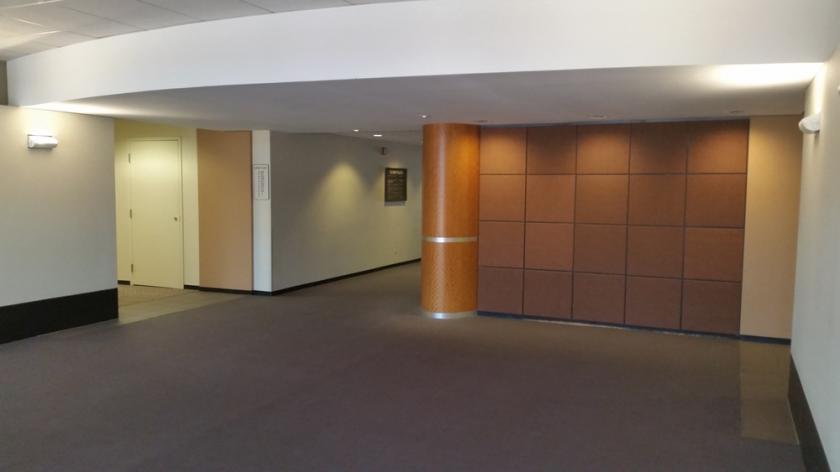
- • Premium professional setting
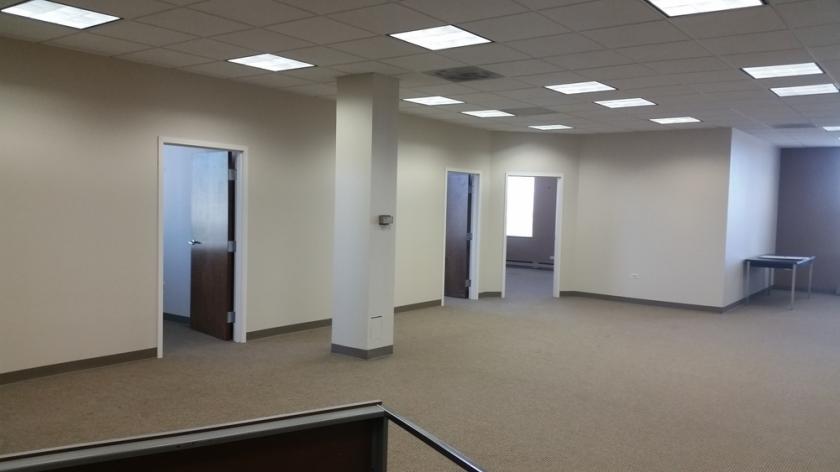
- • Spaces available immediately in move-in condition
- • Abundant parking
- • Nearby amenities include dining and shopping
- • Can accommodate a full-floor user
Additional Photos

Listing Agents

Kevin O'Donnell
O: 630-400-7327
M: 630-444-0444
kevin@odcre.com
O: 630-400-7327
M: 630-444-0444
kevin@odcre.com
While we strive to provide the most accurate information, all listing information, and demographic data, is provided by third-parties. As such, MyEListing will not be responsible for the accuracy of the information. It is strongly recommended that you verify all information with the listing agent, and any relevant agencies, prior to making any decisions.


