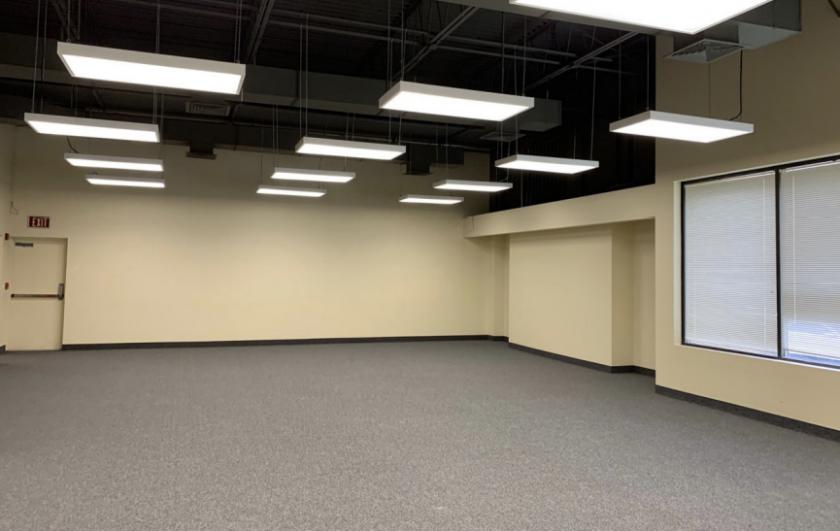
Flex-Office-Warehouse
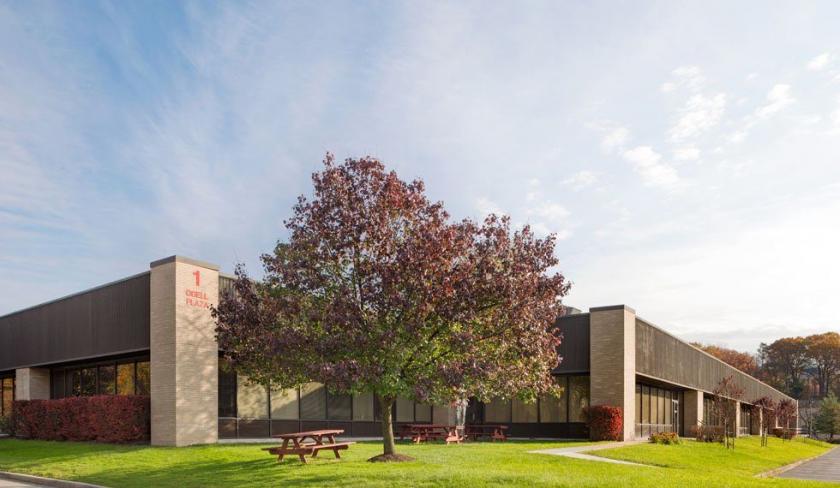
1 Odell Plaza Yonkers, NY 10701
1 Odell Plaza Yonkers, NY 10701
Details & Description
Property Highlights
• Adjacent to hotels and retail amenities
• 1 story building
Listing Agents

William Anson
O: 914-363-7906
M: 203-984-0046
wanson@rmfriedland.com
O: 914-363-7906
M: 203-984-0046
wanson@rmfriedland.com
While we strive to provide the most accurate information, all listing information, and demographic data, is provided by third-parties. As such, MyEListing will not be responsible for the accuracy of the information. It is strongly recommended that you verify all information with the listing agent, and any relevant agencies, prior to making any decisions.