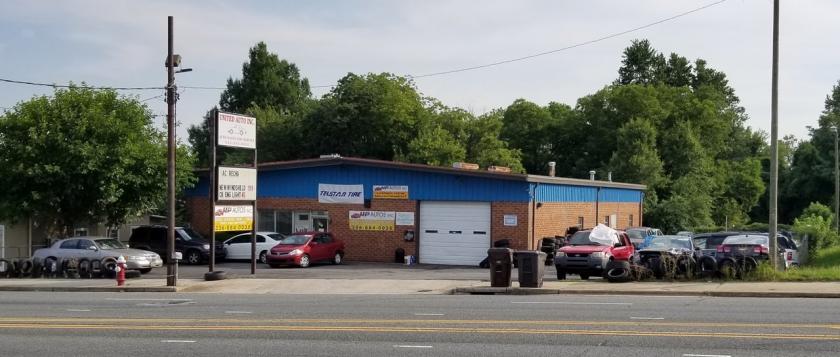
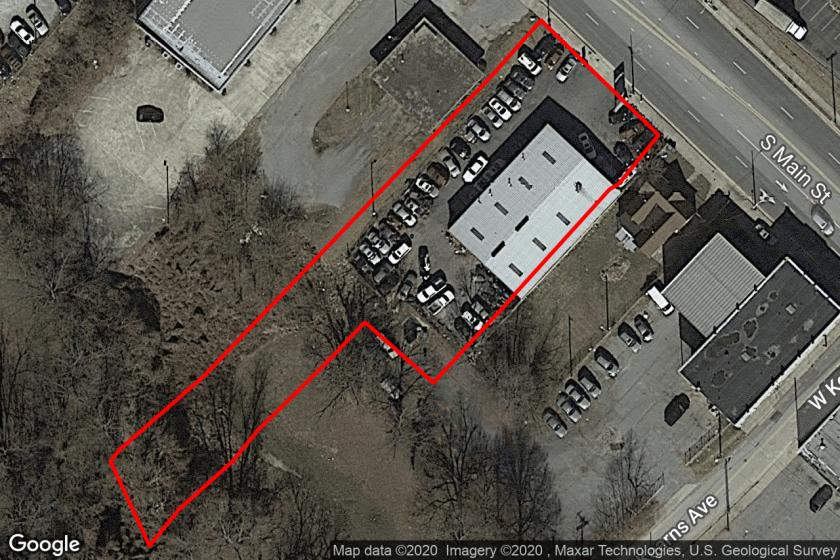
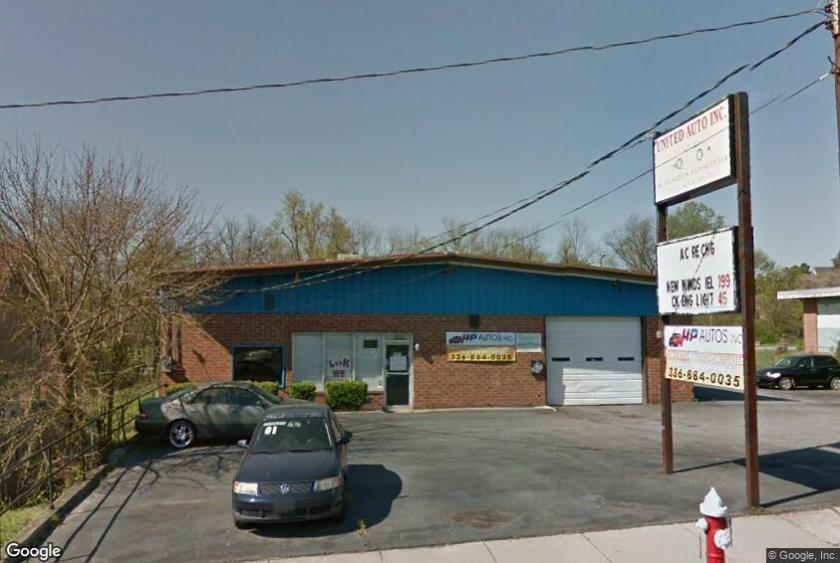
1-Mile | 3-Miles | 5-Miles | ||
---|---|---|---|---|
Total Population | 6,985 | 51,282 | 106,231 | |
Population Median Age | 34 | 37 | 38 | |
Population by Age | 0-9 Yrs | 1086 (15%) | 6924 (13%) | 13740 (12%) |
10-19 Yrs | 1266 (18%) | 8189 (15%) | 15632 (14%) | |
20-29 Yrs | 826 (11%) | 7836 (15%) | 15139 (14%) | |
30-39 Yrs | 987 (14%) | 6060 (11%) | 12518 (11%) | |
40-49 Yrs | 881 (12%) | 5639 (10%) | 12835 (12%) | |
50-59 Yrs | 753 (10%) | 6369 (12%) | 14224 (13%) | |
60-69 Yrs | 718 (10%) | 5369 (10%) | 10710 (10%) | |
70+ Yrs | 468 (6%) | 4896 (9%) | 11433 (10%) | |
Median HH Income | $26,885 | $33,838 | $40,755 | |
Total Household Income | < 24K | 1080 (46%) | 6745 (36%) | 11586 (28%) |
25-49K | 912 (38%) | 5784 (31%) | 12306 (30%) | |
50-74K | 213 (9%) | 2612 (14%) | 6600 (16%) | |
75-99K | 91 (3%) | 1163 (6%) | 4043 (10%) | |
100-199K | 45 (1%) | 1569 (8%) | 4705 (11%) | |
200K+ | 1 (0%) | 377 (2%) | 867 (2%) | |
Highest Education Level | No Diploma | 1467 | 8213 | 12928 |
Diploma or GED | 1359 | 9093 | 19938 | |
Some College | 1068 | 6747 | 15628 | |
Assoc. Degree | 204 | 2341 | 5696 | |
Bachelors Degree | 226 | 4211 | 10218 | |
Higher Degree | 15 | 1600 | 4666 | |
Total Housing Units | 2,941 | 21,671 | 45,267 | |
--Owner-Occupied | 407 | 8,095 | 21,793 | |
--Renter-Occupied | 1,936 | 10,154 | 18,315 | |
Owner-Occupied Values | < 100K | 321 | 4138 | 7156 |
100-199K | 74 | 2425 | 10295 | |
200-299K | 10 | 892 | 2947 | |
300-399K | 0 | 208 | 587 | |
400-499K | 1 | 187 | 360 | |
500K+ | 1 | 245 | 447 | |
Total Working Age Population | 5,154 | 40,402 | 84,058 | |
In Work Force | 2,560 | 23,362 | 50,758 | |
Not In Work Force | 2,594 | 17,040 | 33,301 | |
Workforce Employed | 2,238 | 21,098 | 46,665 | |
Workforce Unemployed | 320 | 2,201 | 3,973 | |
Civlian Workforce | 2,558 | 23,299 | 50,638 | |
Military Workforce | 2 | 63 | 120 | |
Total Households | 2,342 | 18,249 | 40,108 | |
Family Households | 1,552 | 11,595 | 25,999 | |
Non-Family Households | 790 | 6,653 | 14,109 | |
Married Couple | 597 | 5,871 | 15,773 | |
Other Family | 956 | 5,724 | 10,227 | |
Married w/Child | 211 | 2,247 | 6,083 | |
Single Male w/Child | 116 | 639 | 1,101 | |
Single Female w/Child | 465 | 2,679 | 4,756 |
Population Change Last Two Decades - Plus Projection
2000 | % | 2010 | % | 2020 | % | 2030 | |
---|---|---|---|---|---|---|---|
North Carolina | 8,049,313 | +18 | 9,535,483 | +11 | 10,630,691 | +11 | 11,836,070 |
Davidson County | 147,246 | +11 | 162,878 | +5 | 170,888 | +8 | 184,987 |
Forsyth County | 306,067 | +15 | 350,670 | +9 | 383,123 | +9 | 418,257 |
Guilford County | 421,048 | +16 | 488,406 | +12 | 545,348 | +13 | 615,227 |
Randolph County | 130,454 | +9 | 141,752 | +3 | 145,807 | +6 | 154,739 |
Total Working Age Population:
Total Households:
Total Working Age Population:
Total Households:
Total Working Age Population:
Total Households: