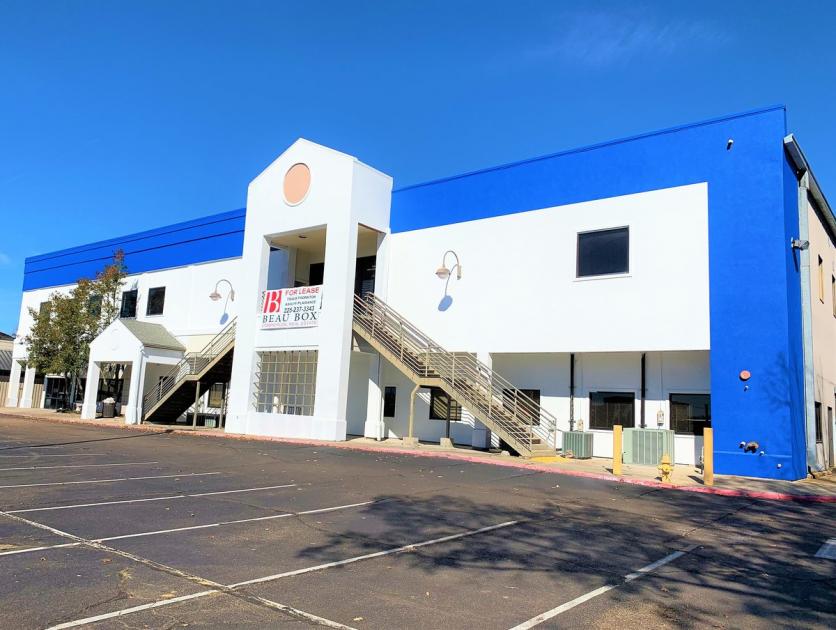
Office Space
5745 Essen Lane Baton Rouge, LA 70810
5745 Essen Lane Baton Rouge, LA 70810
Details & Description
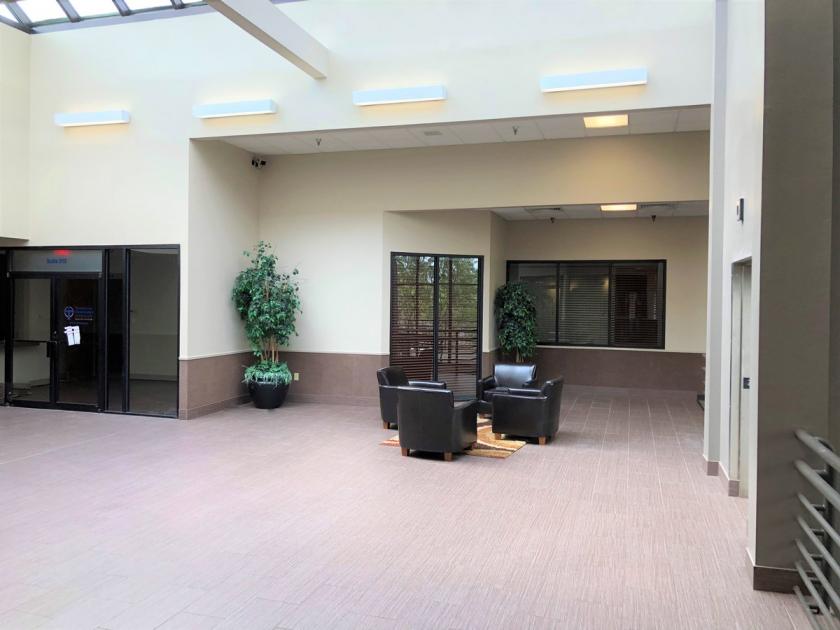
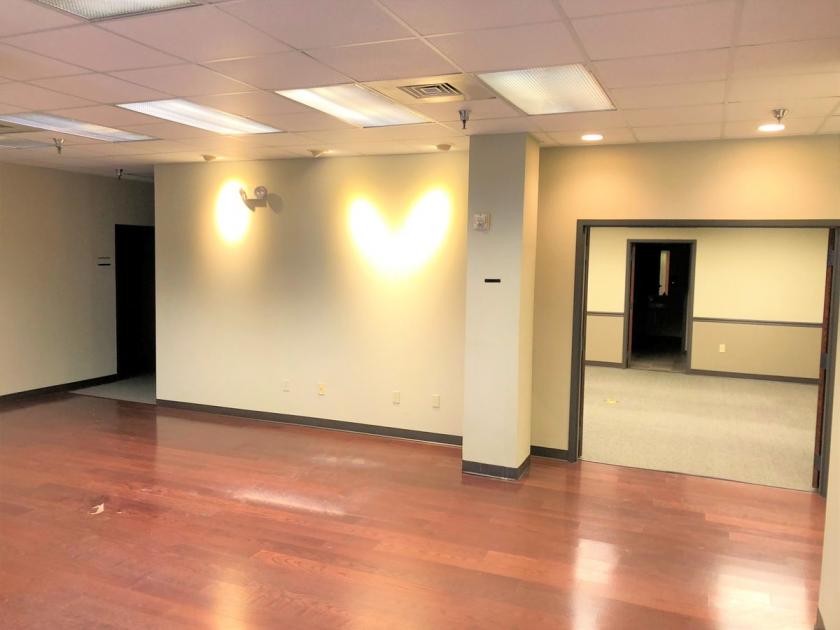
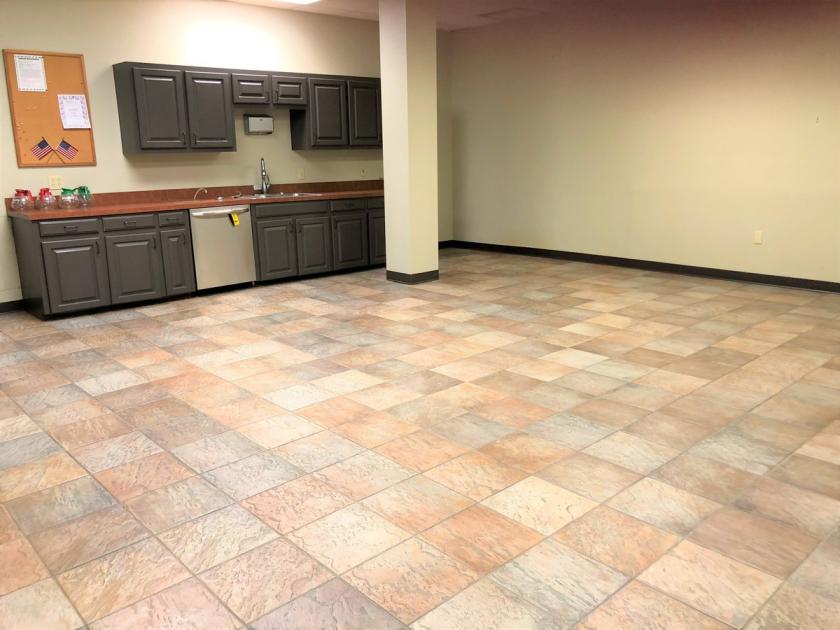
Additional Photos

Listing Agents

Travis Thornton
O: 225-572-5689
tthornton@beaubox.com
O: 225-572-5689
tthornton@beaubox.com

Reiss Weil
O: 225-237-3343
rweil@beaubox.com
O: 225-237-3343
rweil@beaubox.com

Ashlyn Plaisance
O: 225-717-2790
ashlynp@beaubox.com
O: 225-717-2790
ashlynp@beaubox.com
While we strive to provide the most accurate information, all listing information, and demographic data, is provided by third-parties. As such, MyEListing will not be responsible for the accuracy of the information. It is strongly recommended that you verify all information with the listing agent, and any relevant agencies, prior to making any decisions.


