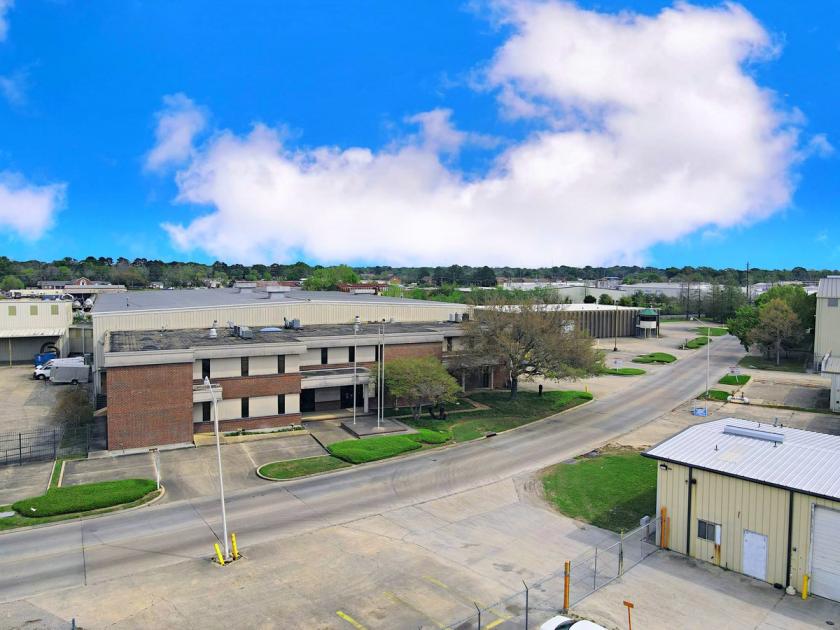
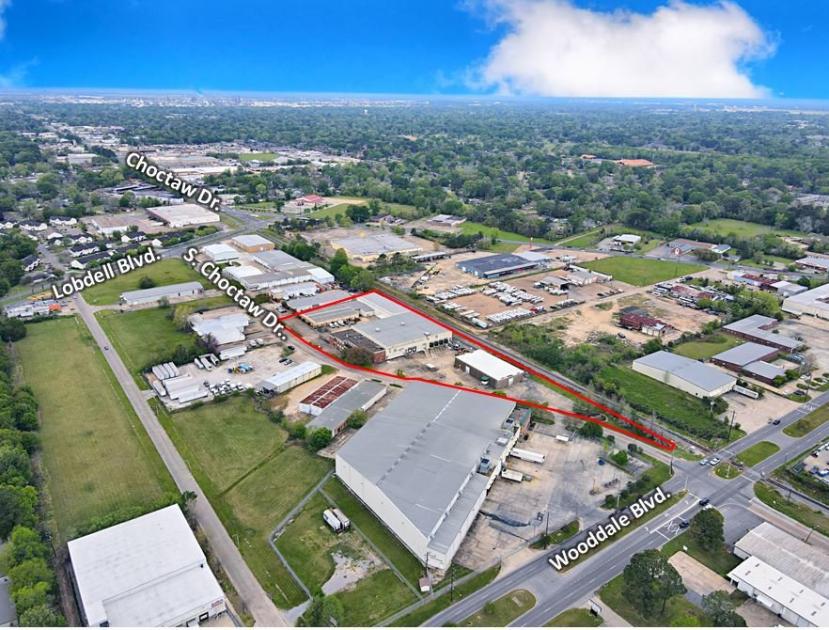
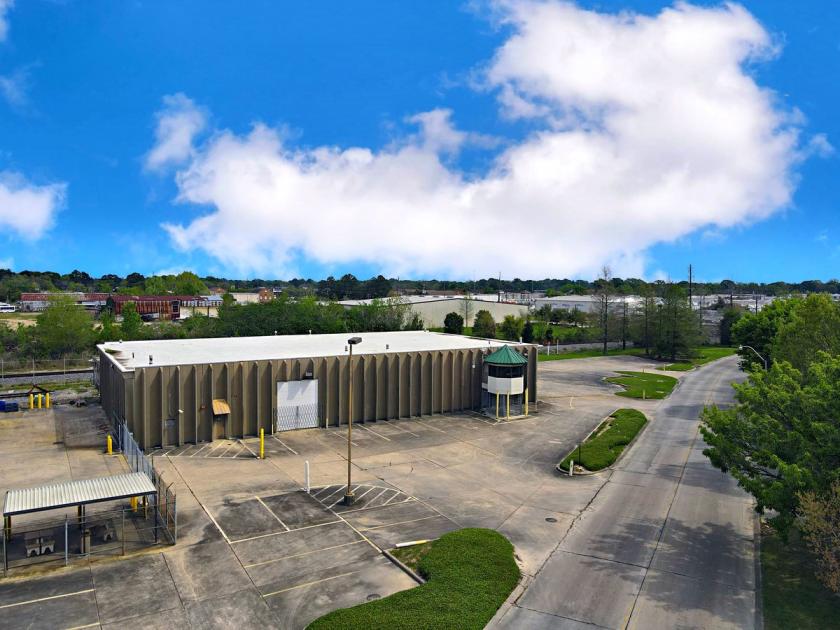
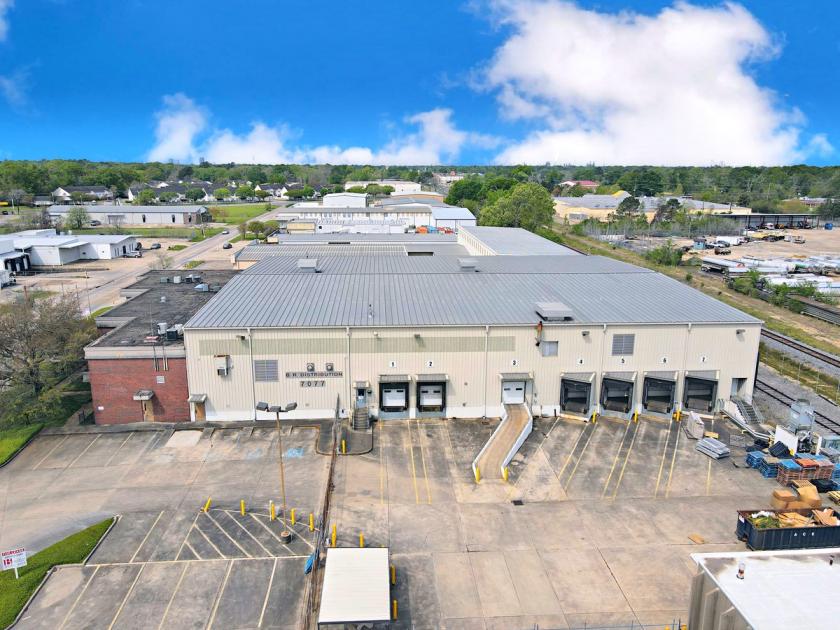
1-Mile | 3-Miles | 5-Miles | ||
---|---|---|---|---|
Total Population | 8,294 | 83,063 | 184,763 | |
Population Median Age | 37 | 36 | 37 | |
Population by Age | 0-9 Yrs | 1084 (13%) | 12581 (15%) | 25673 (13%) |
10-19 Yrs | 1130 (13%) | 10770 (12%) | 24422 (13%) | |
20-29 Yrs | 1420 (17%) | 13674 (16%) | 32176 (17%) | |
30-39 Yrs | 1239 (14%) | 11577 (13%) | 25266 (13%) | |
40-49 Yrs | 740 (8%) | 8010 (9%) | 18940 (10%) | |
50-59 Yrs | 1138 (13%) | 10122 (12%) | 21796 (11%) | |
60-69 Yrs | 834 (10%) | 9089 (10%) | 19837 (10%) | |
70+ Yrs | 709 (8%) | 7240 (8%) | 16652 (9%) | |
Median HH Income | $27,561 | $35,678 | $43,999 | |
Total Household Income | < 24K | 1624 (46%) | 11148 (36%) | 21252 (30%) |
25-49K | 1139 (32%) | 8323 (27%) | 16663 (24%) | |
50-74K | 357 (10%) | 4134 (13%) | 11254 (16%) | |
75-99K | 175 (5%) | 2517 (8%) | 6612 (9%) | |
100-199K | 169 (4%) | 3484 (11%) | 9869 (14%) | |
200K+ | 31 (0%) | 996 (3%) | 3237 (4%) | |
Highest Education Level | No Diploma | 1176 | 8372 | 15382 |
Diploma or GED | 1873 | 17310 | 35293 | |
Some College | 1386 | 12392 | 26990 | |
Assoc. Degree | 182 | 2293 | 5335 | |
Bachelors Degree | 451 | 7465 | 21172 | |
Higher Degree | 171 | 4445 | 12714 | |
Total Housing Units | 4,243 | 36,948 | 82,492 | |
--Owner-Occupied | 940 | 14,772 | 35,698 | |
--Renter-Occupied | 2,556 | 15,829 | 33,190 | |
Owner-Occupied Values | < 100K | 450 | 5788 | 9888 |
100-199K | 413 | 5252 | 13477 | |
200-299K | 39 | 1883 | 6345 | |
300-399K | 0 | 733 | 2260 | |
400-499K | 0 | 339 | 1169 | |
500K+ | 37 | 777 | 2560 | |
Total Working Age Population | 6,581 | 64,280 | 145,751 | |
In Work Force | 4,251 | 40,806 | 93,766 | |
Not In Work Force | 2,330 | 23,474 | 51,985 | |
Workforce Employed | 3,701 | 36,322 | 85,227 | |
Workforce Unemployed | 549 | 4,457 | 8,496 | |
Civlian Workforce | 4,251 | 40,780 | 93,723 | |
Military Workforce | 0 | 26 | 43 | |
Total Households | 3,496 | 30,602 | 68,888 | |
Family Households | 1,722 | 17,323 | 38,659 | |
Non-Family Households | 1,774 | 13,279 | 30,228 | |
Married Couple | 581 | 8,077 | 20,538 | |
Other Family | 1,141 | 9,246 | 18,121 | |
Married w/Child | 137 | 2,552 | 6,834 | |
Single Male w/Child | 53 | 618 | 1,399 | |
Single Female w/Child | 602 | 3,960 | 7,346 |
Population Change Last Two Decades - Plus Projection
2000 | % | 2010 | % | 2020 | % | 2030 | |
---|---|---|---|---|---|---|---|
Louisiana | 4,468,976 | +1 | 4,533,372 | +1 | 4,588,310 | +5 | 4,813,420 |
East Baton Rouge Parish | 412,852 | +7 | 440,171 | -3 | 426,380 | -1 | 421,500 |
Iberville Parish | 33,320 | 0 | 33,387 | -17 | 27,830 | -11 | 24,640 |
St. Martin Parish | 48,583 | +7 | 52,160 | +6 | 55,520 | +3 | 57,000 |
West Baton Rouge Parish | 21,601 | +10 | 23,788 | -7 | 22,220 | -5 | 21,070 |
Total Working Age Population:
Total Households:
Total Working Age Population:
Total Households:
Total Working Age Population:
Total Households: