Industrial Properties
1870 Grand Terre Lane Port Allen, LA 70767
1870 Grand Terre Lane Port Allen, LA 70767
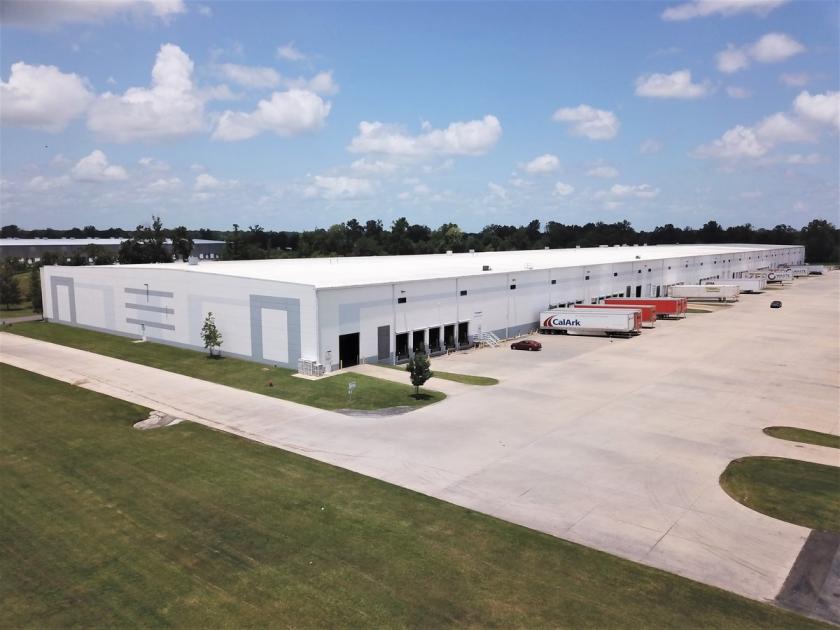
Details & Description
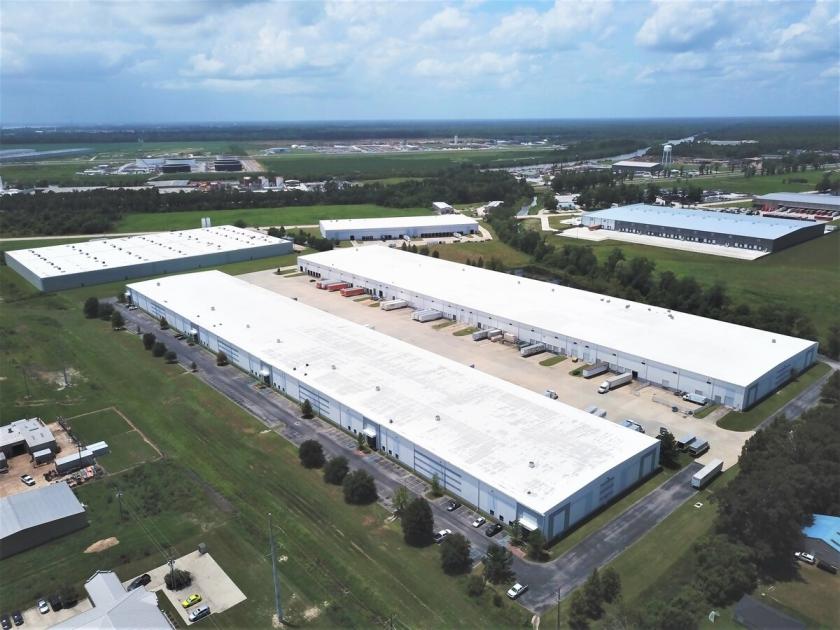
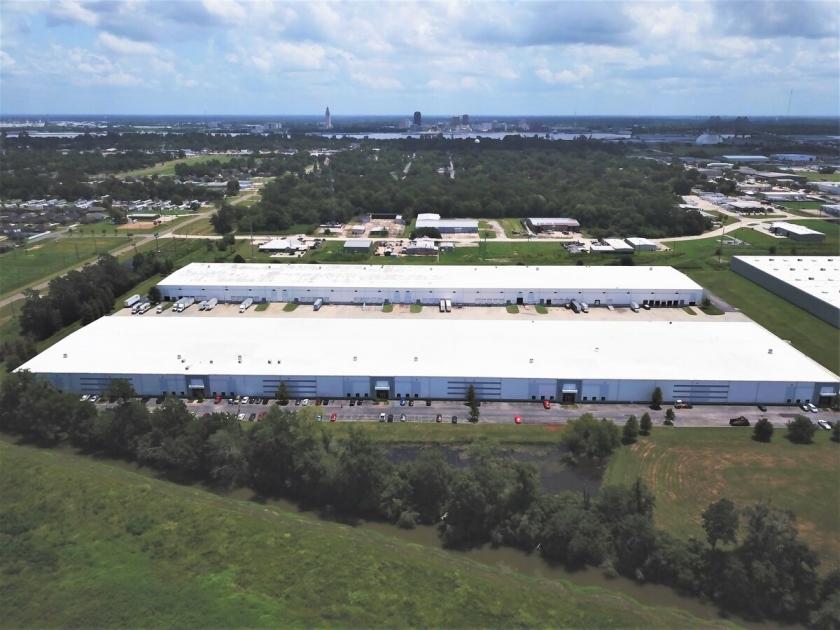
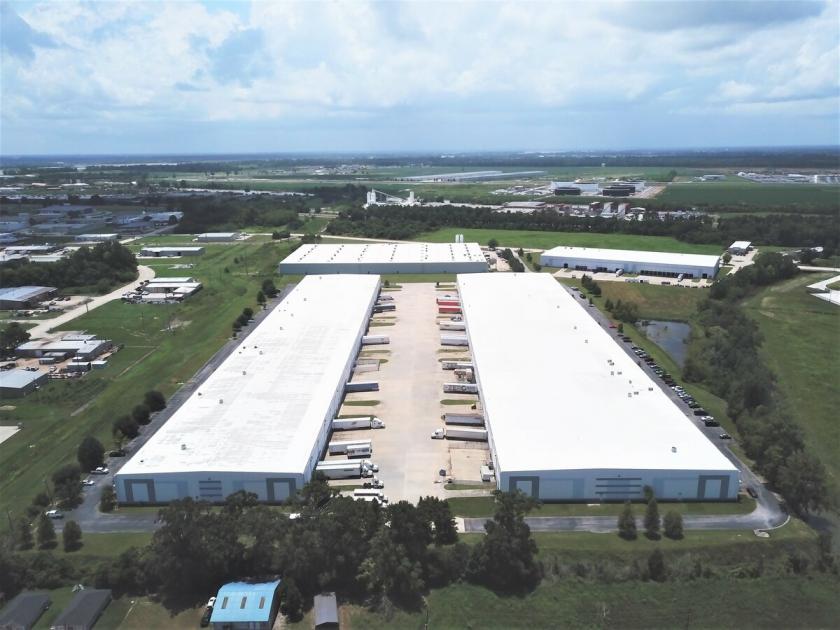
Additional Photos

Listing Agents

Brent Garrett
O: 225-978-2071
bgarrett@beaubox.com
O: 225-978-2071
bgarrett@beaubox.com
While we strive to provide the most accurate information, all listing information, and demographic data, is provided by third-parties. As such, MyEListing will not be responsible for the accuracy of the information. It is strongly recommended that you verify all information with the listing agent, and any relevant agencies, prior to making any decisions.


