Commercial Land
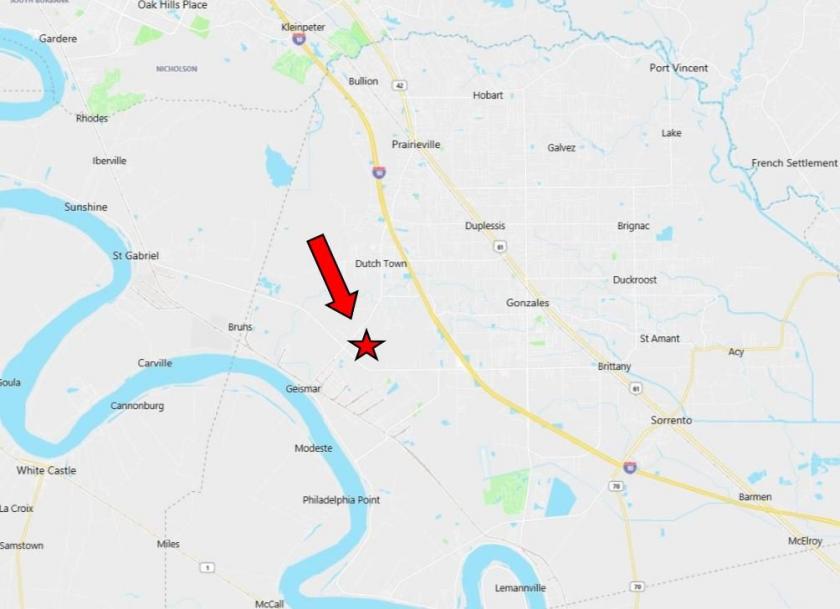
LA Highway 30 Geismar, LA 70734
LA Highway 30 Geismar, LA 70734
Details & Description
Property Highlights
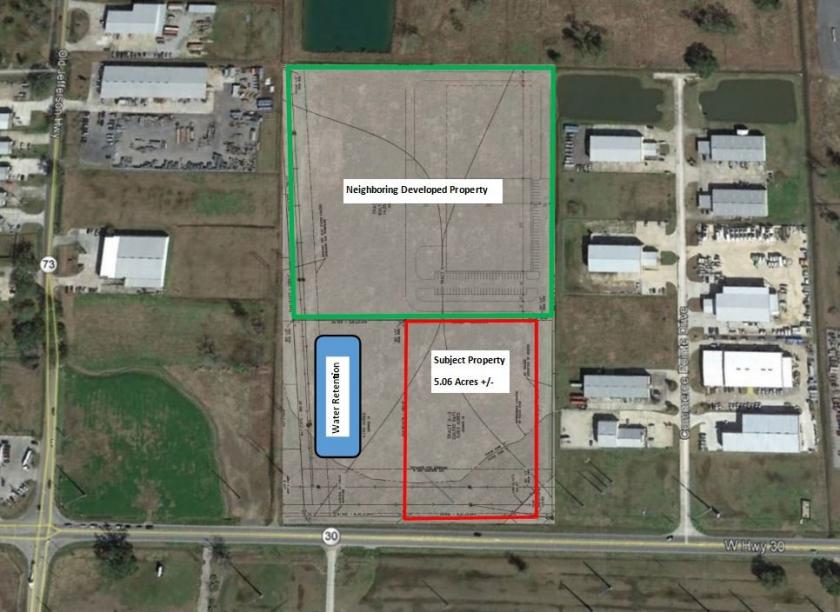
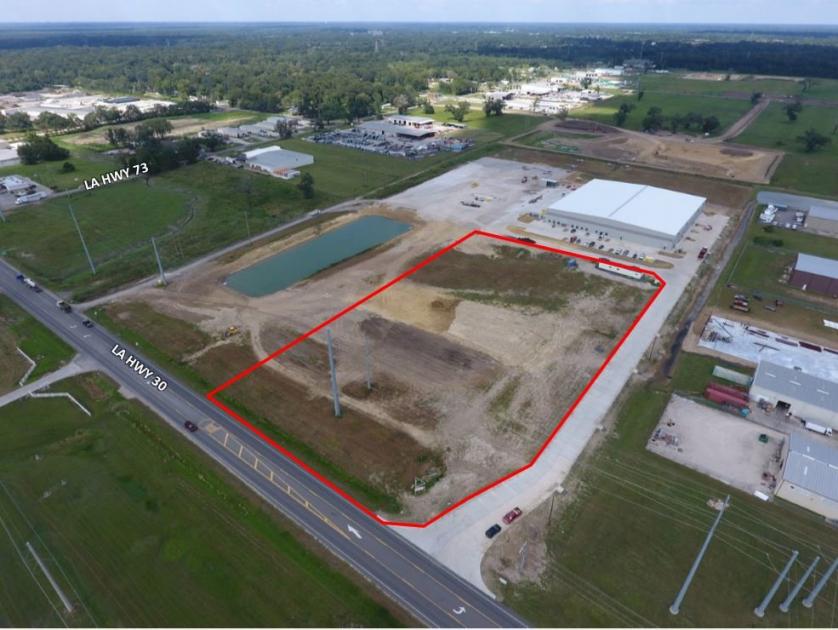
- • Zoned Heavy Industrial
- • Rectangular
- • Development Ready
- • Near Hwy 73 Intersection
- • 383 Feet of Hwy 30 Frontage
- • Owner will entertain a BTS
Listing Agents

Brent Garrett
O: 225-978-2071
bgarrett@beaubox.com
O: 225-978-2071
bgarrett@beaubox.com
While we strive to provide the most accurate information, all listing information, and demographic data, is provided by third-parties. As such, MyEListing will not be responsible for the accuracy of the information. It is strongly recommended that you verify all information with the listing agent, and any relevant agencies, prior to making any decisions.