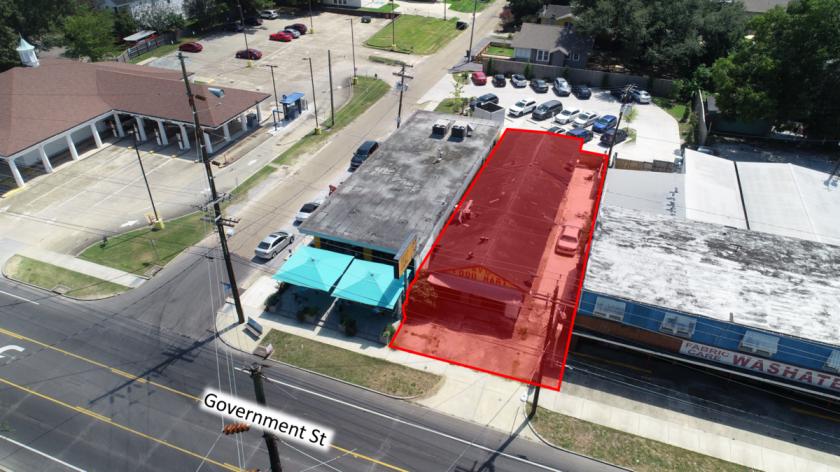
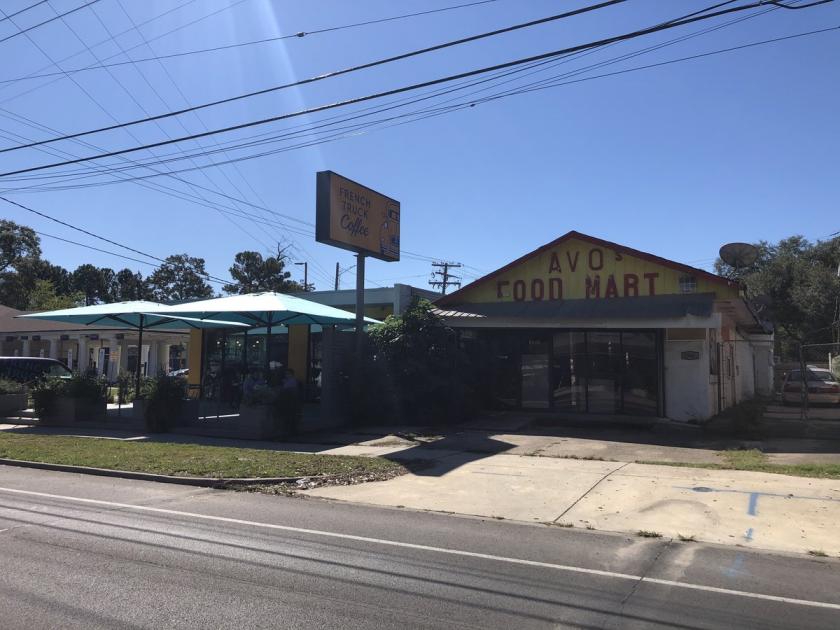
1-Mile | 3-Miles | 5-Miles | ||
---|---|---|---|---|
Total Population | 12,766 | 83,711 | 170,275 | |
Population Median Age | 39 | 36 | 36 | |
Population by Age | 0-9 Yrs | 1421 (11%) | 9423 (11%) | 20697 (12%) |
10-19 Yrs | 1208 (9%) | 11923 (14%) | 23536 (13%) | |
20-29 Yrs | 2303 (18%) | 17778 (21%) | 37575 (22%) | |
30-39 Yrs | 2046 (16%) | 11293 (13%) | 21660 (12%) | |
40-49 Yrs | 1496 (11%) | 8594 (10%) | 16054 (9%) | |
50-59 Yrs | 1719 (13%) | 8847 (10%) | 17813 (10%) | |
60-69 Yrs | 1429 (11%) | 9098 (10%) | 17946 (10%) | |
70+ Yrs | 1144 (8%) | 6755 (8%) | 14993 (8%) | |
Median HH Income | $50,944 | $39,581 | $41,498 | |
Total Household Income | < 24K | 1734 (31%) | 11878 (36%) | 21998 (33%) |
25-49K | 971 (17%) | 7132 (21%) | 14699 (22%) | |
50-74K | 814 (14%) | 4450 (13%) | 9257 (14%) | |
75-99K | 580 (10%) | 2744 (8%) | 5603 (8%) | |
100-199K | 974 (17%) | 4663 (14%) | 9711 (14%) | |
200K+ | 403 (7%) | 1899 (5%) | 3859 (5%) | |
Highest Education Level | No Diploma | 992 | 7294 | 13639 |
Diploma or GED | 1985 | 13457 | 27480 | |
Some College | 1396 | 10280 | 21402 | |
Assoc. Degree | 252 | 2203 | 4315 | |
Bachelors Degree | 2541 | 10898 | 20708 | |
Higher Degree | 1797 | 7600 | 15124 | |
Total Housing Units | 6,619 | 40,737 | 80,485 | |
--Owner-Occupied | 3,036 | 14,600 | 30,376 | |
--Renter-Occupied | 2,438 | 18,166 | 34,751 | |
Owner-Occupied Values | < 100K | 674 | 4804 | 8200 |
100-199K | 515 | 3023 | 8298 | |
200-299K | 805 | 2683 | 6418 | |
300-399K | 552 | 1537 | 2979 | |
400-499K | 235 | 856 | 1473 | |
500K+ | 255 | 1697 | 3008 | |
Total Working Age Population | 10,683 | 69,507 | 139,477 | |
In Work Force | 7,560 | 44,830 | 87,688 | |
Not In Work Force | 3,123 | 24,677 | 51,789 | |
Workforce Employed | 6,995 | 39,865 | 79,556 | |
Workforce Unemployed | 565 | 4,949 | 8,028 | |
Civlian Workforce | 7,560 | 44,814 | 87,584 | |
Military Workforce | 0 | 17 | 105 | |
Total Households | 5,475 | 32,766 | 65,126 | |
Family Households | 2,602 | 15,620 | 33,075 | |
Non-Family Households | 2,873 | 17,146 | 32,051 | |
Married Couple | 1,653 | 8,364 | 18,478 | |
Other Family | 949 | 7,256 | 14,597 | |
Married w/Child | 574 | 2,733 | 6,134 | |
Single Male w/Child | 63 | 326 | 995 | |
Single Female w/Child | 403 | 2,875 | 6,077 |
Population Change Last Two Decades - Plus Projection
2000 | % | 2010 | % | 2020 | % | 2030 | |
---|---|---|---|---|---|---|---|
Louisiana | 4,468,976 | +1 | 4,533,372 | +1 | 4,588,310 | +5 | 4,813,420 |
East Baton Rouge Parish | 412,852 | +7 | 440,171 | -3 | 426,380 | -1 | 421,500 |
Iberville Parish | 33,320 | 0 | 33,387 | -17 | 27,830 | -11 | 24,640 |
St. Martin Parish | 48,583 | +7 | 52,160 | +6 | 55,520 | +3 | 57,000 |
West Baton Rouge Parish | 21,601 | +10 | 23,788 | -7 | 22,220 | -5 | 21,070 |
Total Working Age Population:
Total Households:
Total Working Age Population:
Total Households:
Total Working Age Population:
Total Households: