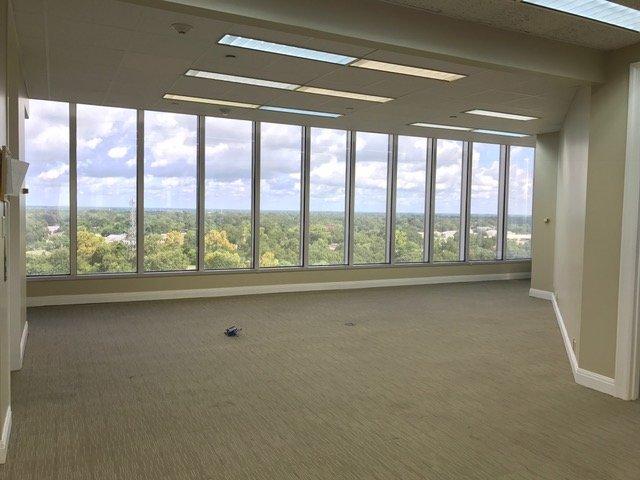
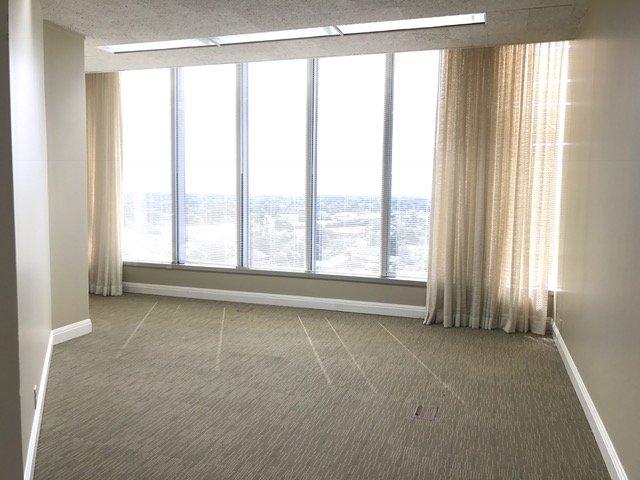
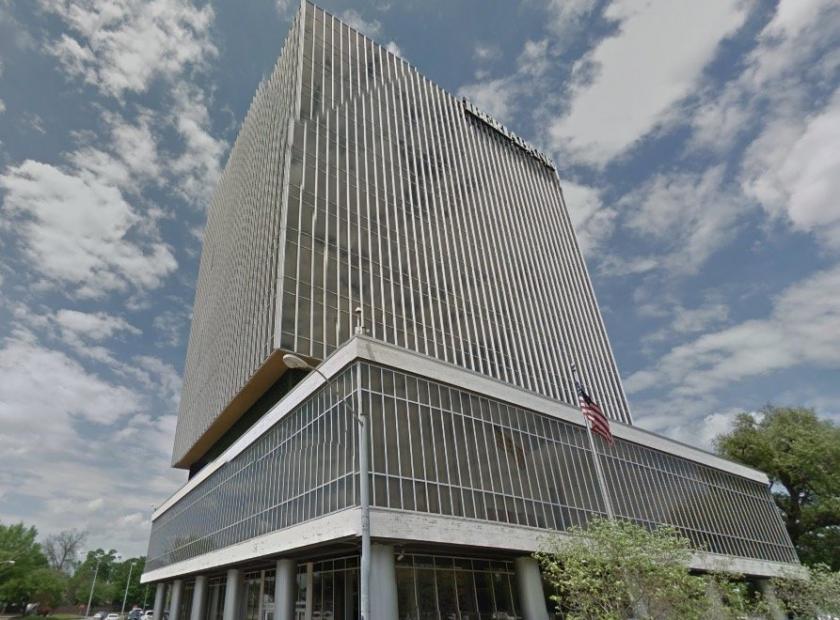
1-Mile | 3-Miles | 5-Miles | ||
---|---|---|---|---|
Total Population | 12,537 | 61,103 | 126,070 | |
Population Median Age | 36 | 37 | 38 | |
Population by Age | 0-9 Yrs | 1276 (10%) | 6508 (10%) | 15021 (11%) |
10-19 Yrs | 1686 (13%) | 8824 (14%) | 15981 (12%) | |
20-29 Yrs | 2996 (23%) | 12520 (20%) | 22203 (17%) | |
30-39 Yrs | 1986 (15%) | 8071 (13%) | 17026 (13%) | |
40-49 Yrs | 1030 (8%) | 5790 (9%) | 13454 (10%) | |
50-59 Yrs | 1397 (11%) | 7034 (11%) | 15936 (12%) | |
60-69 Yrs | 1278 (10%) | 7019 (11%) | 15030 (11%) | |
70+ Yrs | 888 (7%) | 5337 (8%) | 11420 (9%) | |
Median HH Income | $31,050 | $37,186 | $46,580 | |
Total Household Income | < 24K | 1940 (43%) | 8285 (35%) | 14547 (29%) |
25-49K | 1275 (28%) | 6094 (26%) | 11627 (23%) | |
50-74K | 604 (13%) | 3423 (14%) | 8174 (16%) | |
75-99K | 262 (5%) | 2046 (8%) | 5460 (10%) | |
100-199K | 274 (6%) | 2466 (10%) | 7326 (14%) | |
200K+ | 156 (3%) | 1035 (4%) | 2811 (5%) | |
Highest Education Level | No Diploma | 1745 | 6271 | 10173 |
Diploma or GED | 2355 | 12085 | 24728 | |
Some College | 1562 | 7651 | 16711 | |
Assoc. Degree | 309 | 1665 | 3901 | |
Bachelors Degree | 1412 | 7668 | 19253 | |
Higher Degree | 690 | 3770 | 9240 | |
Total Housing Units | 5,290 | 26,883 | 56,709 | |
--Owner-Occupied | 1,726 | 11,449 | 27,542 | |
--Renter-Occupied | 2,784 | 11,899 | 22,402 | |
Owner-Occupied Values | < 100K | 640 | 3138 | 5121 |
100-199K | 558 | 4069 | 11446 | |
200-299K | 323 | 2104 | 5976 | |
300-399K | 111 | 950 | 2056 | |
400-499K | 30 | 416 | 975 | |
500K+ | 64 | 772 | 1969 | |
Total Working Age Population | 10,482 | 49,979 | 102,003 | |
In Work Force | 6,126 | 30,557 | 64,919 | |
Not In Work Force | 4,356 | 19,422 | 37,084 | |
Workforce Employed | 5,757 | 28,526 | 61,221 | |
Workforce Unemployed | 369 | 2,024 | 3,671 | |
Civlian Workforce | 6,126 | 30,550 | 64,891 | |
Military Workforce | 0 | 7 | 27 | |
Total Households | 4,510 | 23,348 | 49,945 | |
Family Households | 1,918 | 12,167 | 27,857 | |
Non-Family Households | 2,593 | 11,181 | 22,087 | |
Married Couple | 932 | 6,871 | 17,857 | |
Other Family | 985 | 5,296 | 10,001 | |
Married w/Child | 304 | 2,001 | 6,521 | |
Single Male w/Child | 54 | 292 | 909 | |
Single Female w/Child | 470 | 2,597 | 4,560 |
Population Change Last Two Decades - Plus Projection
2000 | % | 2010 | % | 2020 | % | 2030 | |
---|---|---|---|---|---|---|---|
Louisiana | 4,468,976 | +1 | 4,533,372 | +1 | 4,588,310 | +5 | 4,813,420 |
Lafayette Parish | 190,503 | +16 | 221,578 | -2 | 216,520 | +2 | 221,600 |
St. Martin Parish | 48,583 | +7 | 52,160 | +6 | 55,520 | +3 | 57,000 |
Total Working Age Population:
Total Households:
Total Working Age Population:
Total Households:
Total Working Age Population:
Total Households: