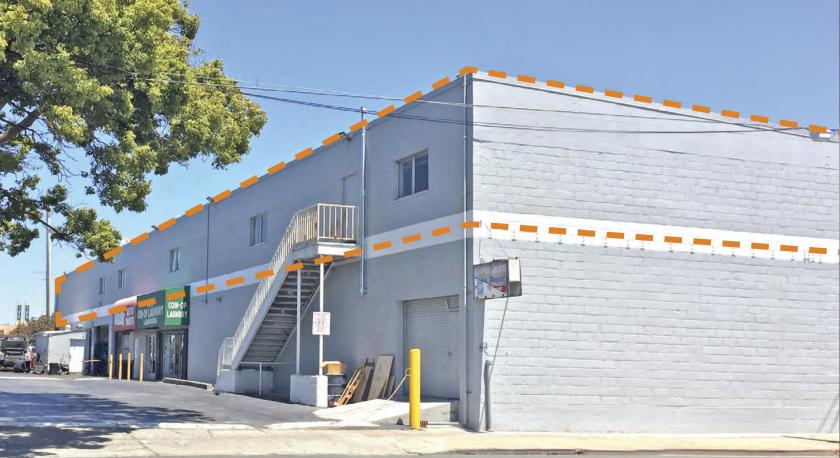
Office Space
12915 San Pablo Avenue Richmond, CA 94805
12915 San Pablo Avenue Richmond, CA 94805
Details & Description
Property Highlights
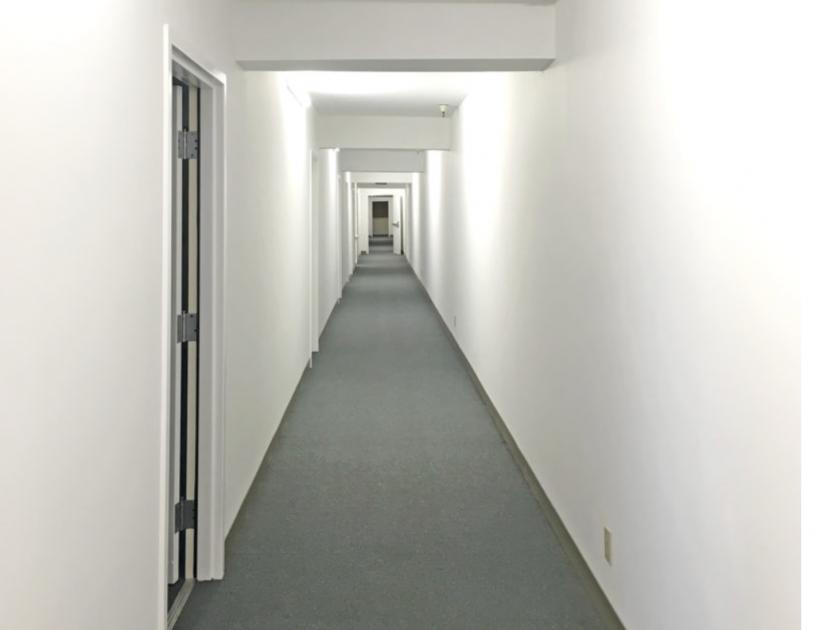
- • Open floor plan
- • Adaptable to many uses
- • Two shared restrooms
- • No elevator access
- • Fully-sprinklered
- • Excellent signage opportunity
Listing Agents

Kevin Gordon
O: 510-898-0513
kevin@gordoncommercial.com
O: 510-898-0513
kevin@gordoncommercial.com

Lori Rosenthal
Gordon CRE Brokerage
O: 510-524-2344
lori@gordoncommercial.com
Gordon CRE Brokerage
O: 510-524-2344
lori@gordoncommercial.com
While we strive to provide the most accurate information, all listing information, and demographic data, is provided by third-parties. As such, MyEListing will not be responsible for the accuracy of the information. It is strongly recommended that you verify all information with the listing agent, and any relevant agencies, prior to making any decisions.