Commercial Land
450 Lewiston Road Grovetown, GA 30813
450 Lewiston Road Grovetown, GA 30813
Details & Description
Property Highlights
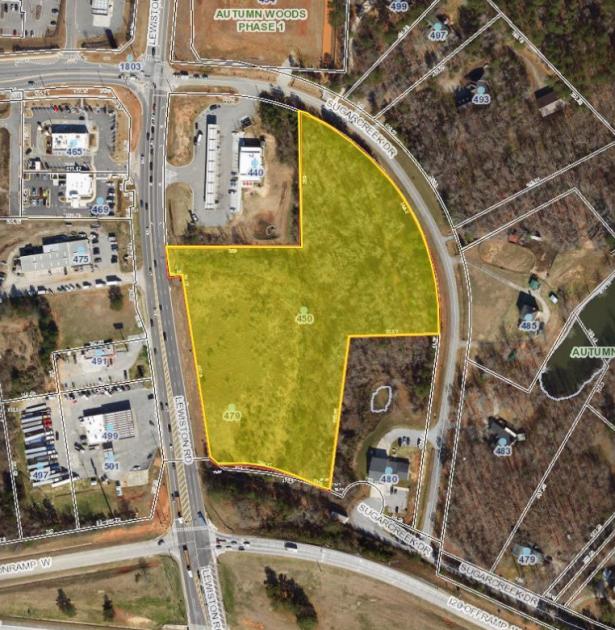
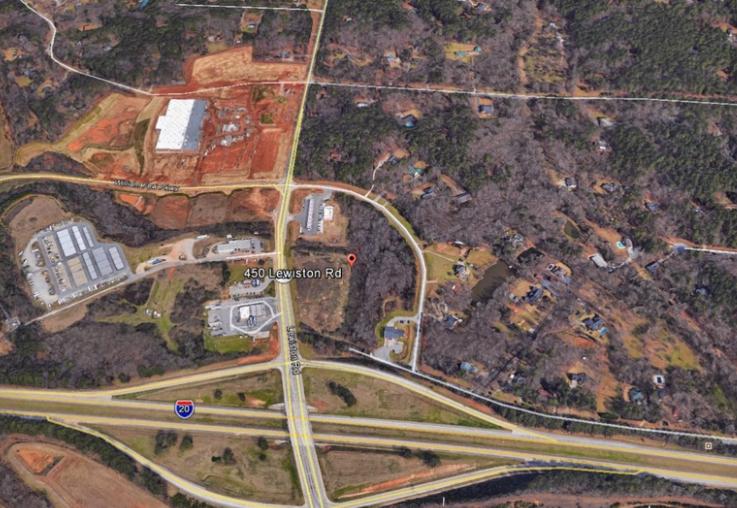
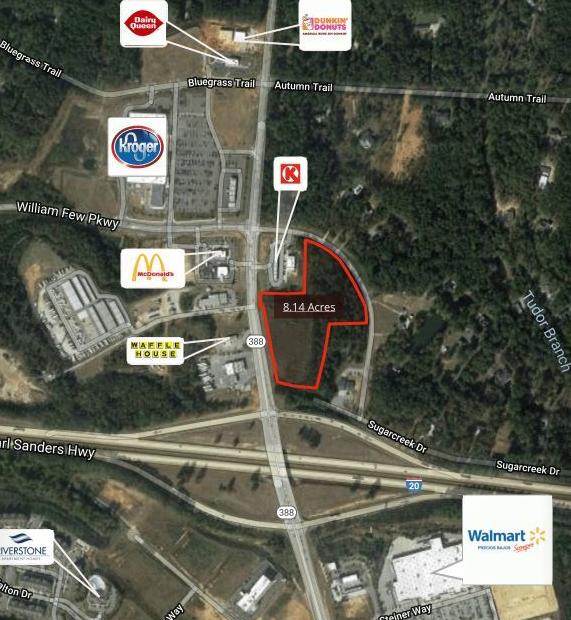
- • Located at Lewiston Road at I-20 in Grovetown
- • Zoned C-2 General Business
- • Fastest Growing Interchange In Augusta MSA
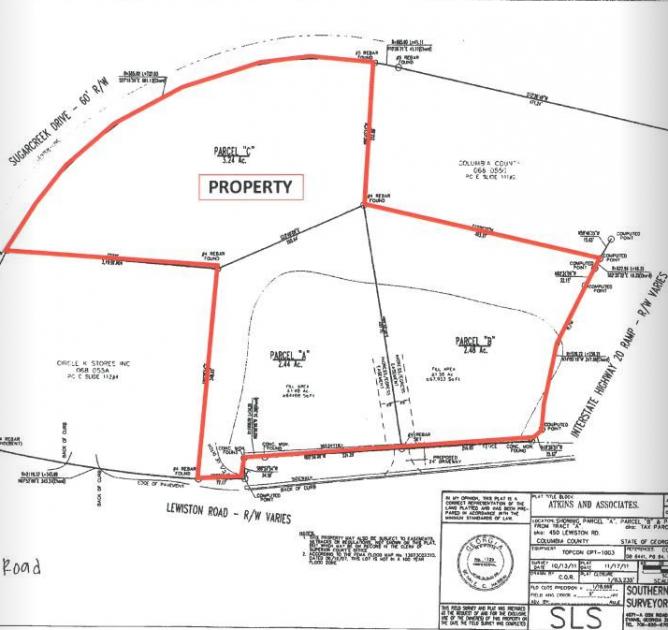
- • Access from Lewiston Road and Sugarcreek Rd
Additional Photos

Listing Agents

Scott A. Atkins
O: 706-951-6630
M: 706-650-1446
scott@atkinsrealty.com
O: 706-951-6630
M: 706-650-1446
scott@atkinsrealty.com
While we strive to provide the most accurate information, all listing information, and demographic data, is provided by third-parties. As such, MyEListing will not be responsible for the accuracy of the information. It is strongly recommended that you verify all information with the listing agent, and any relevant agencies, prior to making any decisions.


