Commercial Land
1808 Tobacco Road Augusta, GA 30906
1808 Tobacco Road Augusta, GA 30906
Details & Description
Property Highlights
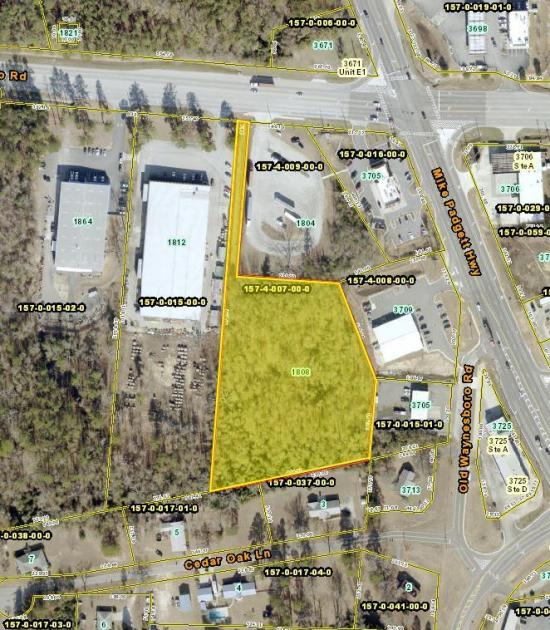
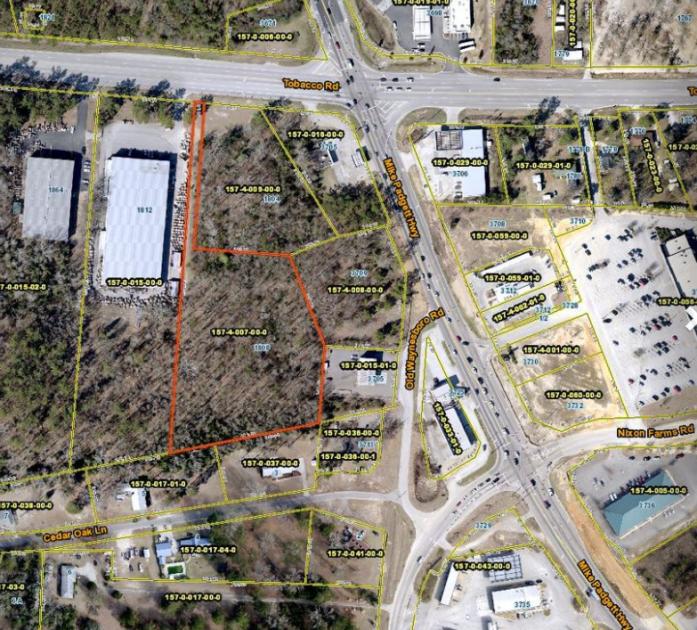
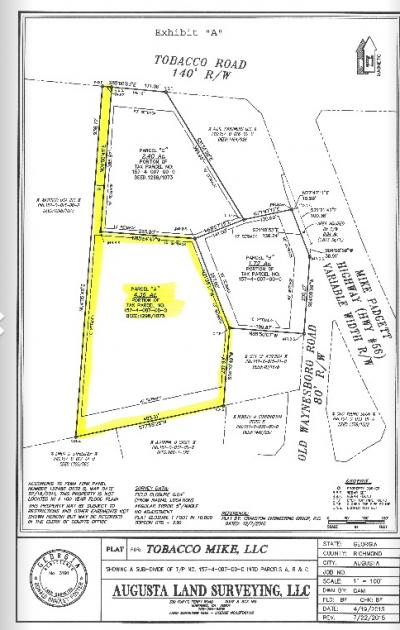
- • 4.36 Acres
- • Zoned HI Heavy Industrial
- • Great Location at Major Intersection
- • Access from Tobacco Rd
- • Located behind new Family Dollar and Bojangles
Additional Photos

Listing Agents

Scott A. Atkins
O: 706-951-6630
M: 706-650-1446
scott@atkinsrealty.com
O: 706-951-6630
M: 706-650-1446
scott@atkinsrealty.com
While we strive to provide the most accurate information, all listing information, and demographic data, is provided by third-parties. As such, MyEListing will not be responsible for the accuracy of the information. It is strongly recommended that you verify all information with the listing agent, and any relevant agencies, prior to making any decisions.


