Industrial Properties
2122 Noland Connector Road Augusta, GA 30909
2122 Noland Connector Road Augusta, GA 30909

Details & Description
Property Highlights
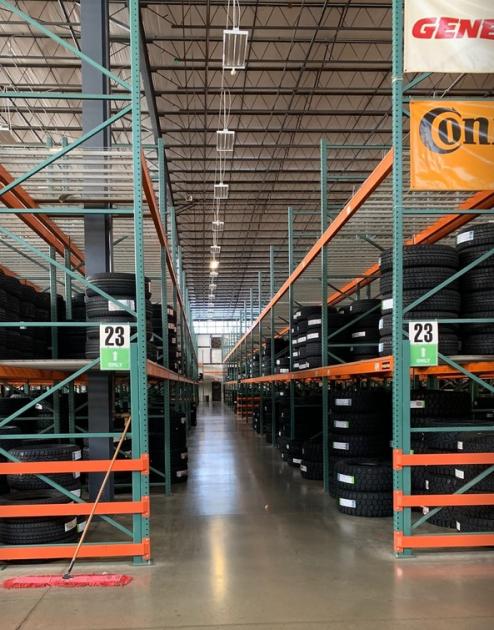
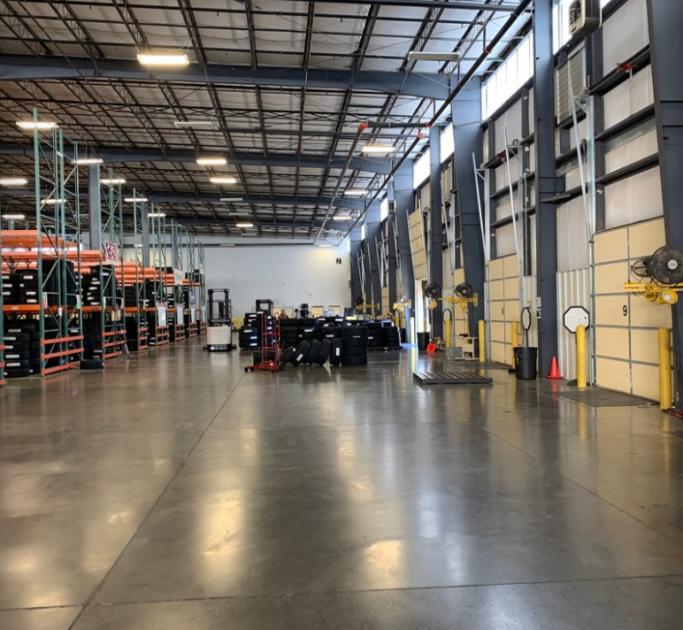
- • 27,000 sq. ft. Sublease
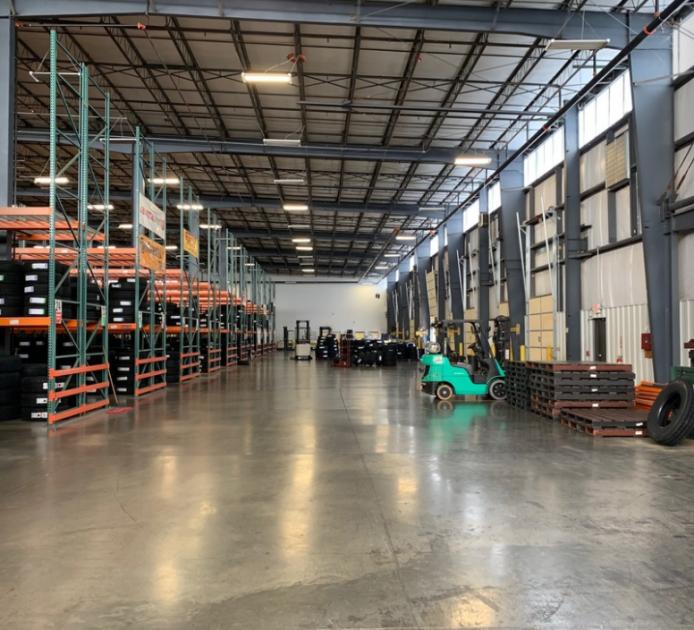
- • Class A Warehouse Space
- • Less than 14 mile From Bobby Jones Expressway
- • 27 Clear Ceiling Height
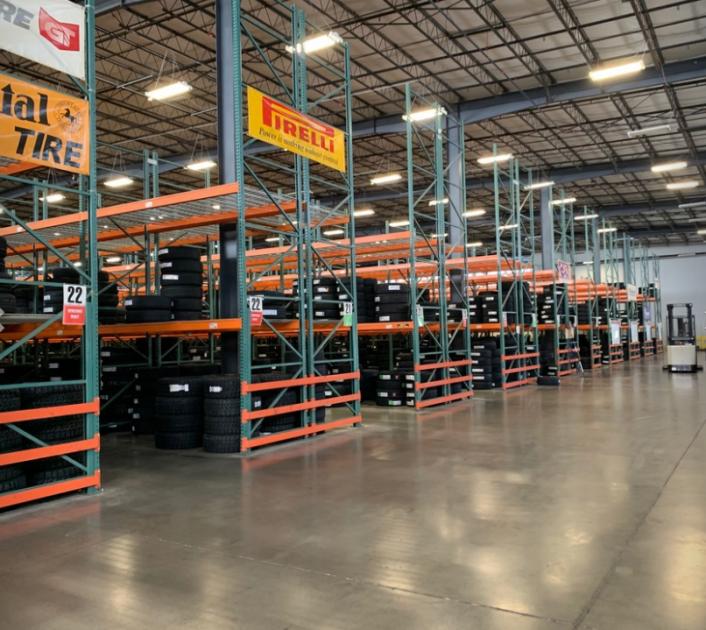
- • Existing Racking Can Be Used by Tenant
Additional Photos
Listing Agents

Scott A. Atkins
O: 706-951-6630
M: 706-650-1446
scott@atkinsrealty.com
O: 706-951-6630
M: 706-650-1446
scott@atkinsrealty.com
While we strive to provide the most accurate information, all listing information, and demographic data, is provided by third-parties. As such, MyEListing will not be responsible for the accuracy of the information. It is strongly recommended that you verify all information with the listing agent, and any relevant agencies, prior to making any decisions.


