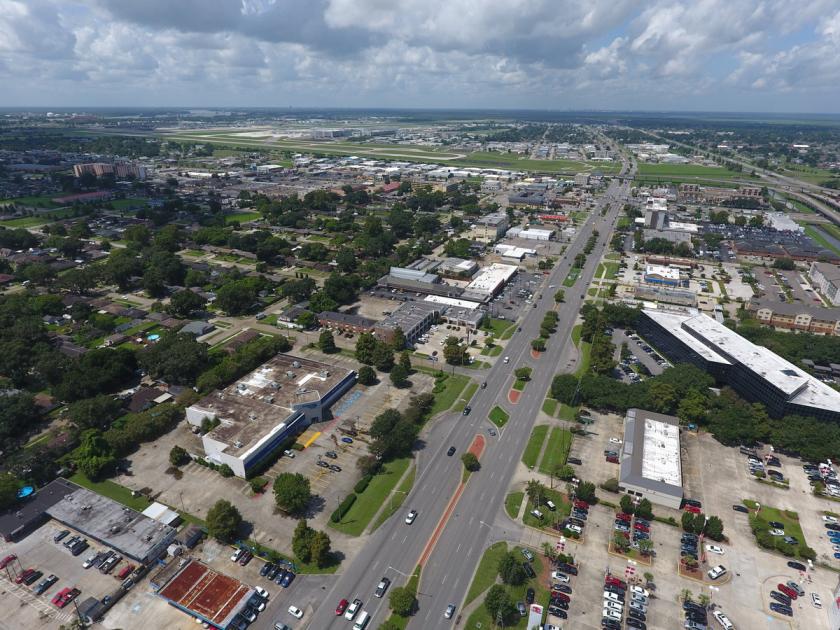
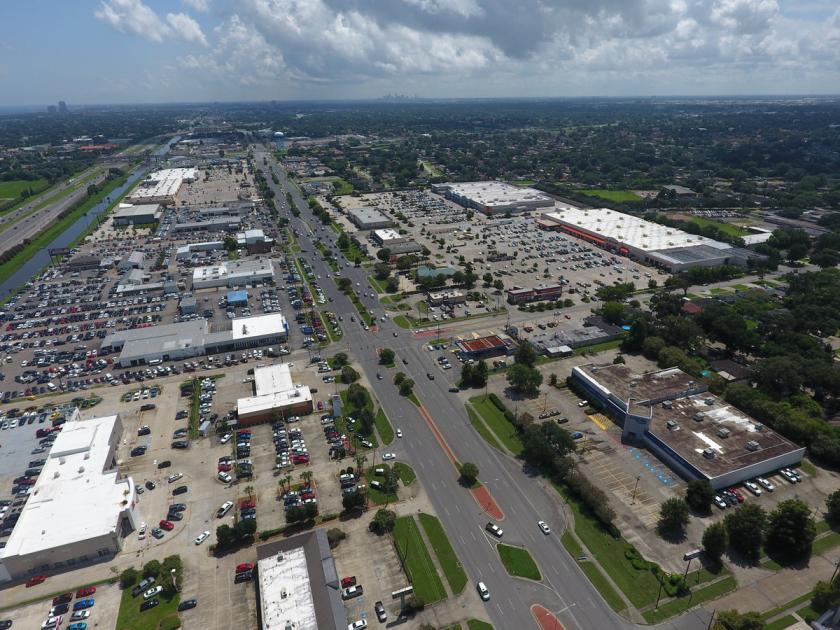
1-Mile | 3-Miles | 5-Miles | ||
---|---|---|---|---|
Total Population | 16,078 | 130,743 | 221,548 | |
Population Median Age | 40 | 40 | 40 | |
Population by Age | 0-9 Yrs | 1941 (12%) | 15988 (12%) | 26930 (12%) |
10-19 Yrs | 1866 (11%) | 14797 (11%) | 23696 (10%) | |
20-29 Yrs | 2387 (14%) | 17131 (13%) | 29573 (13%) | |
30-39 Yrs | 1859 (11%) | 17494 (13%) | 30846 (13%) | |
40-49 Yrs | 1882 (11%) | 14978 (11%) | 26621 (12%) | |
50-59 Yrs | 2267 (14%) | 18283 (13%) | 29807 (13%) | |
60-69 Yrs | 2157 (13%) | 16534 (12%) | 28606 (12%) | |
70+ Yrs | 1719 (10%) | 15537 (11%) | 25467 (11%) | |
Median HH Income | $55,931 | $55,441 | $57,058 | |
Total Household Income | < 24K | 1394 (23%) | 11590 (22%) | 18917 (21%) |
25-49K | 1284 (21%) | 11430 (22%) | 20089 (22%) | |
50-74K | 1111 (19%) | 9074 (17%) | 15876 (17%) | |
75-99K | 624 (10%) | 6559 (12%) | 11266 (12%) | |
100-199K | 1297 (22%) | 9776 (19%) | 18216 (20%) | |
200K+ | 128 (2%) | 2387 (4%) | 4425 (4%) | |
Highest Education Level | No Diploma | 1975 | 12480 | 18054 |
Diploma or GED | 3755 | 28072 | 46729 | |
Some College | 2512 | 20567 | 35701 | |
Assoc. Degree | 529 | 5419 | 9010 | |
Bachelors Degree | 1736 | 17510 | 32178 | |
Higher Degree | 646 | 7985 | 16098 | |
Total Housing Units | 6,207 | 55,933 | 97,370 | |
--Owner-Occupied | 3,567 | 31,518 | 52,570 | |
--Renter-Occupied | 2,271 | 19,298 | 36,220 | |
Owner-Occupied Values | < 100K | 226 | 2505 | 4234 |
100-199K | 2066 | 13764 | 19939 | |
200-299K | 1180 | 10000 | 17207 | |
300-399K | 92 | 2972 | 6127 | |
400-499K | 0 | 1328 | 2618 | |
500K+ | 2 | 949 | 2445 | |
Total Working Age Population | 13,077 | 105,244 | 179,688 | |
In Work Force | 8,512 | 67,453 | 117,491 | |
Not In Work Force | 4,565 | 37,791 | 62,197 | |
Workforce Employed | 8,203 | 64,225 | 111,821 | |
Workforce Unemployed | 308 | 3,025 | 5,272 | |
Civlian Workforce | 8,511 | 67,249 | 117,093 | |
Military Workforce | 1 | 204 | 398 | |
Total Households | 5,838 | 50,816 | 88,790 | |
Family Households | 3,974 | 32,660 | 55,478 | |
Non-Family Households | 1,864 | 18,156 | 33,312 | |
Married Couple | 2,586 | 22,236 | 38,566 | |
Other Family | 1,387 | 10,424 | 16,912 | |
Married w/Child | 1,019 | 8,315 | 13,927 | |
Single Male w/Child | 193 | 1,273 | 2,064 | |
Single Female w/Child | 502 | 3,538 | 6,127 |
Population Change Last Two Decades - Plus Projection
2000 | % | 2010 | % | 2020 | % | 2030 | |
---|---|---|---|---|---|---|---|
Louisiana | 4,468,976 | +1 | 4,533,372 | +1 | 4,588,310 | +5 | 4,813,420 |
Jefferson Parish | 455,466 | -5 | 432,552 | +4 | 450,200 | +1 | 454,670 |
St. Charles Parish | 48,072 | +10 | 52,780 | +10 | 57,930 | +5 | 60,580 |
St. John the Baptist Parish | 43,044 | +7 | 45,924 | +25 | 57,410 | +13 | 65,110 |
Total Working Age Population:
Total Households:
Total Working Age Population:
Total Households:
Total Working Age Population:
Total Households: