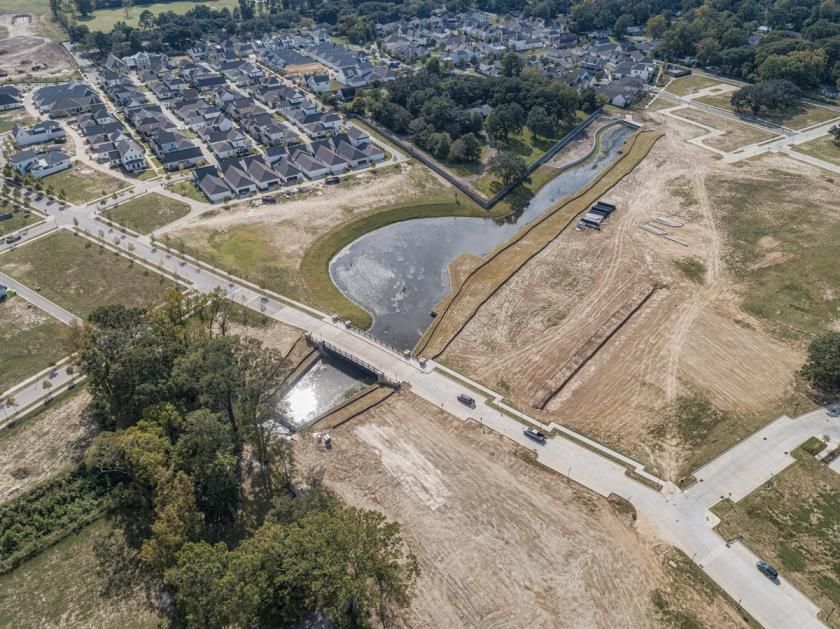
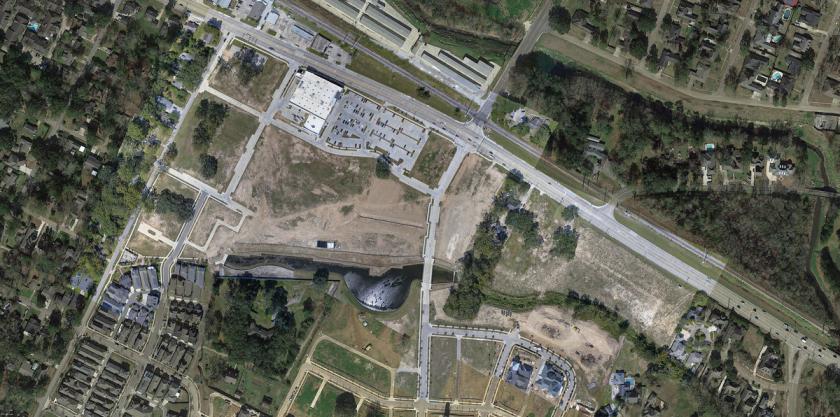
1-Mile | 3-Miles | 5-Miles | ||
---|---|---|---|---|
Total Population | 5,539 | 77,162 | 183,027 | |
Population Median Age | 40 | 36 | 37 | |
Population by Age | 0-9 Yrs | 633 (11%) | 7814 (10%) | 20749 (11%) |
10-19 Yrs | 513 (9%) | 10123 (13%) | 21659 (11%) | |
20-29 Yrs | 1158 (20%) | 19919 (25%) | 43205 (23%) | |
30-39 Yrs | 606 (10%) | 10182 (13%) | 24310 (13%) | |
40-49 Yrs | 676 (12%) | 7528 (9%) | 18447 (10%) | |
50-59 Yrs | 568 (10%) | 6469 (8%) | 18820 (10%) | |
60-69 Yrs | 718 (12%) | 7677 (9%) | 19477 (10%) | |
70+ Yrs | 665 (12%) | 7451 (9%) | 16360 (8%) | |
Median HH Income | $82,206 | $58,814 | $50,288 | |
Total Household Income | < 24K | 375 (16%) | 7996 (25%) | 20630 (28%) |
25-49K | 397 (17%) | 5747 (18%) | 15987 (21%) | |
50-74K | 296 (12%) | 4650 (14%) | 10989 (14%) | |
75-99K | 255 (11%) | 3273 (10%) | 7251 (9%) | |
100-199K | 548 (24%) | 6806 (21%) | 13436 (18%) | |
200K+ | 412 (18%) | 2971 (9%) | 5221 (7%) | |
Highest Education Level | No Diploma | 136 | 2641 | 10915 |
Diploma or GED | 535 | 7601 | 26039 | |
Some College | 715 | 8407 | 23877 | |
Assoc. Degree | 175 | 1745 | 5052 | |
Bachelors Degree | 1219 | 14131 | 28188 | |
Higher Degree | 955 | 11715 | 20066 | |
Total Housing Units | 2,690 | 38,745 | 89,612 | |
--Owner-Occupied | 1,418 | 15,368 | 36,151 | |
--Renter-Occupied | 865 | 16,076 | 37,363 | |
Owner-Occupied Values | < 100K | 58 | 1165 | 5692 |
100-199K | 114 | 3404 | 10876 | |
200-299K | 364 | 4388 | 8921 | |
300-399K | 247 | 2401 | 4917 | |
400-499K | 210 | 1349 | 2024 | |
500K+ | 426 | 2661 | 3722 | |
Total Working Age Population | 4,638 | 65,833 | 152,158 | |
In Work Force | 2,974 | 43,576 | 100,541 | |
Not In Work Force | 1,664 | 22,257 | 51,617 | |
Workforce Employed | 2,879 | 40,955 | 93,599 | |
Workforce Unemployed | 84 | 2,564 | 6,838 | |
Civlian Workforce | 2,963 | 43,519 | 100,437 | |
Military Workforce | 11 | 57 | 103 | |
Total Households | 2,283 | 31,444 | 73,514 | |
Family Households | 1,281 | 14,611 | 35,792 | |
Non-Family Households | 1,003 | 16,832 | 37,722 | |
Married Couple | 980 | 10,729 | 22,699 | |
Other Family | 301 | 3,882 | 13,093 | |
Married w/Child | 328 | 4,013 | 7,967 | |
Single Male w/Child | 16 | 349 | 1,065 | |
Single Female w/Child | 95 | 1,316 | 5,342 |
Population Change Last Two Decades - Plus Projection
2000 | % | 2010 | % | 2020 | % | 2030 | |
---|---|---|---|---|---|---|---|
Louisiana | 4,468,976 | +1 | 4,533,372 | +1 | 4,588,310 | +5 | 4,813,420 |
Ascension Parish | 76,627 | +40 | 107,215 | +38 | 147,740 | +33 | 196,140 |
East Baton Rouge Parish | 412,852 | +7 | 440,171 | -3 | 426,380 | -1 | 421,500 |
Iberville Parish | 33,320 | 0 | 33,387 | -17 | 27,830 | -11 | 24,640 |
St. Martin Parish | 48,583 | +7 | 52,160 | +6 | 55,520 | +3 | 57,000 |
West Baton Rouge Parish | 21,601 | +10 | 23,788 | -7 | 22,220 | -5 | 21,070 |
Total Working Age Population:
Total Households:
Total Working Age Population:
Total Households:
Total Working Age Population:
Total Households: