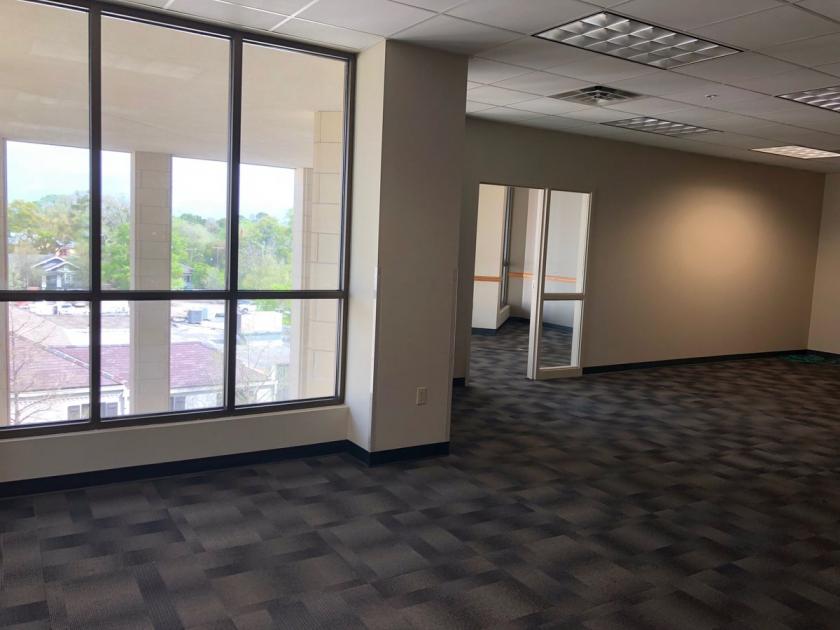
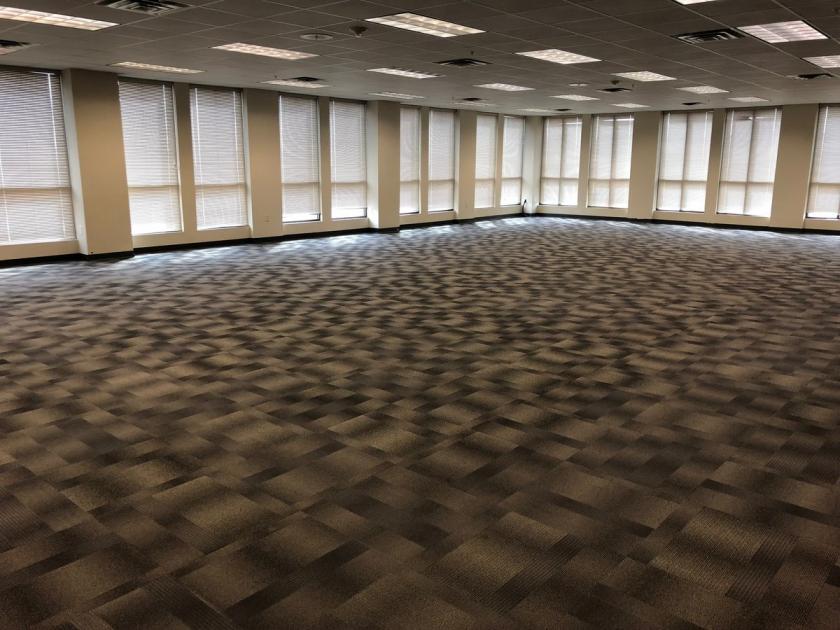
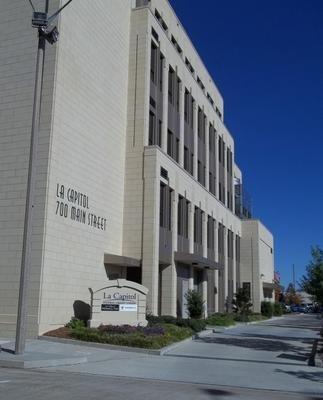
1-Mile | 3-Miles | 5-Miles | ||
---|---|---|---|---|
Total Population | 6,577 | 63,549 | 144,417 | |
Population Median Age | 38 | 37 | 35 | |
Population by Age | 0-9 Yrs | 673 (10%) | 6535 (10%) | 16794 (11%) |
10-19 Yrs | 520 (7%) | 9203 (14%) | 21210 (14%) | |
20-29 Yrs | 1424 (21%) | 13382 (21%) | 33617 (23%) | |
30-39 Yrs | 1095 (16%) | 8364 (13%) | 17941 (12%) | |
40-49 Yrs | 735 (11%) | 6432 (10%) | 13681 (9%) | |
50-59 Yrs | 701 (10%) | 7202 (11%) | 15158 (10%) | |
60-69 Yrs | 960 (14%) | 7209 (11%) | 14450 (10%) | |
70+ Yrs | 471 (7%) | 5222 (8%) | 11567 (8%) | |
Median HH Income | $26,159 | $37,278 | $37,149 | |
Total Household Income | < 24K | 1537 (48%) | 9147 (37%) | 20201 (36%) |
25-49K | 615 (19%) | 5354 (21%) | 12287 (22%) | |
50-74K | 398 (12%) | 3554 (14%) | 7610 (13%) | |
75-99K | 238 (7%) | 1996 (8%) | 4145 (7%) | |
100-199K | 264 (8%) | 3143 (12%) | 7381 (13%) | |
200K+ | 103 (3%) | 1153 (4%) | 3010 (5%) | |
Highest Education Level | No Diploma | 975 | 6335 | 12874 |
Diploma or GED | 1251 | 11447 | 23767 | |
Some College | 909 | 7773 | 17143 | |
Assoc. Degree | 242 | 1769 | 3437 | |
Bachelors Degree | 766 | 7590 | 16077 | |
Higher Degree | 596 | 4894 | 11937 | |
Total Housing Units | 3,934 | 30,768 | 68,843 | |
--Owner-Occupied | 833 | 11,553 | 23,769 | |
--Renter-Occupied | 2,323 | 12,794 | 30,865 | |
Owner-Occupied Values | < 100K | 319 | 4410 | 7749 |
100-199K | 214 | 2637 | 5786 | |
200-299K | 184 | 2133 | 4355 | |
300-399K | 73 | 1047 | 2208 | |
400-499K | 13 | 455 | 1230 | |
500K+ | 31 | 872 | 2441 | |
Total Working Age Population | 5,677 | 53,617 | 118,958 | |
In Work Force | 3,509 | 33,525 | 74,116 | |
Not In Work Force | 2,168 | 20,092 | 44,842 | |
Workforce Employed | 3,075 | 29,503 | 66,422 | |
Workforce Unemployed | 432 | 3,997 | 7,585 | |
Civlian Workforce | 3,508 | 33,500 | 74,007 | |
Military Workforce | 1 | 25 | 109 | |
Total Households | 3,156 | 24,347 | 54,634 | |
Family Households | 863 | 11,804 | 27,230 | |
Non-Family Households | 2,293 | 12,543 | 27,403 | |
Married Couple | 367 | 6,012 | 14,435 | |
Other Family | 497 | 5,792 | 12,795 | |
Married w/Child | 66 | 1,782 | 4,843 | |
Single Male w/Child | 32 | 270 | 784 | |
Single Female w/Child | 215 | 2,110 | 5,314 |
Population Change Last Two Decades - Plus Projection
2000 | % | 2010 | % | 2020 | % | 2030 | |
---|---|---|---|---|---|---|---|
Louisiana | 4,468,976 | +1 | 4,533,372 | +1 | 4,588,310 | +5 | 4,813,420 |
East Baton Rouge Parish | 412,852 | +7 | 440,171 | -3 | 426,380 | -1 | 421,500 |
Iberville Parish | 33,320 | 0 | 33,387 | -17 | 27,830 | -11 | 24,640 |
St. Martin Parish | 48,583 | +7 | 52,160 | +6 | 55,520 | +3 | 57,000 |
West Baton Rouge Parish | 21,601 | +10 | 23,788 | -7 | 22,220 | -5 | 21,070 |
Total Working Age Population:
Total Households:
Total Working Age Population:
Total Households:
Total Working Age Population:
Total Households: