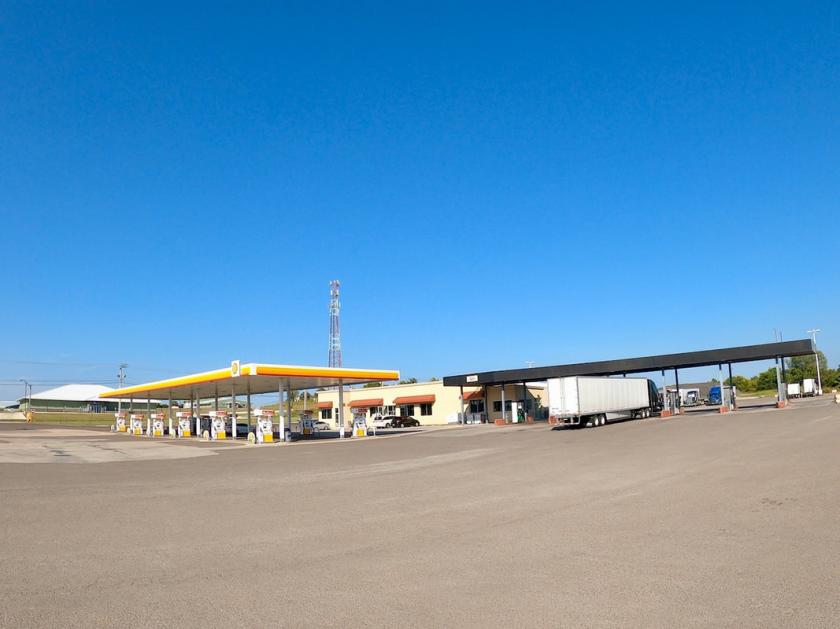
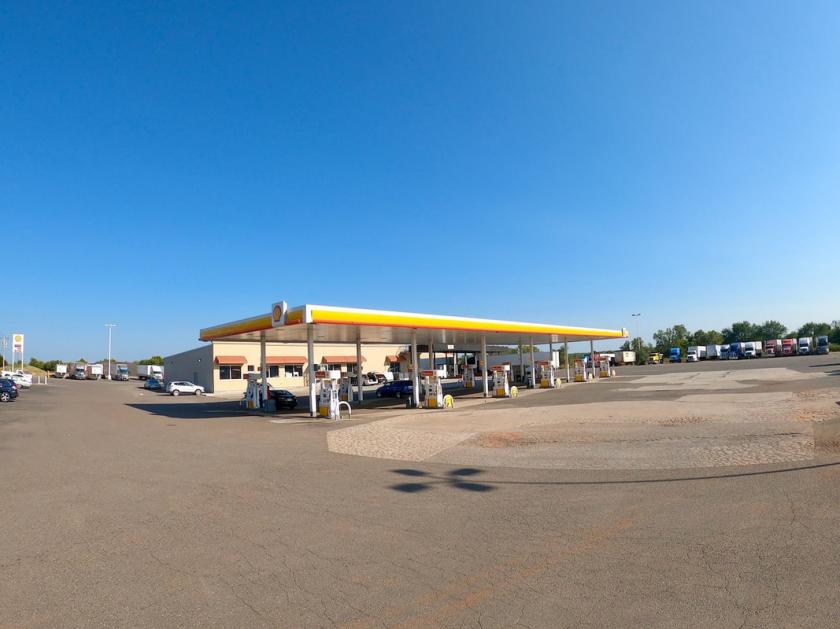
1-Mile | 3-Miles | 5-Miles | ||
---|---|---|---|---|
Total Population | 856 | 17,879 | 55,774 | |
Population Median Age | 39 | 39 | 38 | |
Population by Age | 0-9 Yrs | 102 (11%) | 2327 (13%) | 7100 (12%) |
10-19 Yrs | 132 (15%) | 2797 (15%) | 8019 (14%) | |
20-29 Yrs | 73 (8%) | 1940 (10%) | 8841 (15%) | |
30-39 Yrs | 94 (10%) | 1976 (11%) | 6948 (12%) | |
40-49 Yrs | 124 (14%) | 2026 (11%) | 5806 (10%) | |
50-59 Yrs | 152 (17%) | 2537 (14%) | 7133 (12%) | |
60-69 Yrs | 121 (14%) | 2426 (13%) | 6464 (11%) | |
70+ Yrs | 58 (6%) | 1849 (10%) | 5462 (9%) | |
Median HH Income | $128,231 | $99,267 | $72,883 | |
Total Household Income | < 24K | 19 (7%) | 550 (8%) | 3036 (14%) |
25-49K | 34 (12%) | 711 (11%) | 4286 (20%) | |
50-74K | 27 (10%) | 872 (14%) | 3500 (16%) | |
75-99K | 30 (11%) | 986 (15%) | 2915 (13%) | |
100-199K | 68 (25%) | 1916 (30%) | 4907 (23%) | |
200K+ | 88 (33%) | 1146 (18%) | 2416 (11%) | |
Highest Education Level | No Diploma | 15 | 255 | 1443 |
Diploma or GED | 109 | 1491 | 6144 | |
Some College | 113 | 2309 | 7863 | |
Assoc. Degree | 21 | 585 | 2282 | |
Bachelors Degree | 186 | 3789 | 10594 | |
Higher Degree | 145 | 3169 | 7538 | |
Total Housing Units | 273 | 6,709 | 23,123 | |
--Owner-Occupied | 251 | 5,357 | 13,650 | |
--Renter-Occupied | 16 | 824 | 7,411 | |
Owner-Occupied Values | < 100K | 25 | 256 | 1126 |
100-199K | 28 | 1402 | 4756 | |
200-299K | 64 | 1733 | 3438 | |
300-399K | 14 | 696 | 1841 | |
400-499K | 24 | 385 | 807 | |
500K+ | 96 | 885 | 1682 | |
Total Working Age Population | 672 | 13,907 | 44,127 | |
In Work Force | 369 | 8,873 | 29,316 | |
Not In Work Force | 303 | 5,035 | 14,811 | |
Workforce Employed | 358 | 8,558 | 28,029 | |
Workforce Unemployed | 7 | 220 | 1,074 | |
Civlian Workforce | 365 | 8,778 | 29,102 | |
Military Workforce | 4 | 94 | 214 | |
Total Households | 266 | 6,181 | 21,060 | |
Family Households | 221 | 4,723 | 14,087 | |
Non-Family Households | 46 | 1,458 | 6,973 | |
Married Couple | 206 | 4,194 | 11,029 | |
Other Family | 15 | 529 | 3,059 | |
Married w/Child | 98 | 1,724 | 4,061 | |
Single Male w/Child | 7 | 92 | 311 | |
Single Female w/Child | 3 | 198 | 1,467 |
Population Change Last Two Decades - Plus Projection
2000 | % | 2010 | % | 2020 | % | 2030 | |
---|---|---|---|---|---|---|---|
Oklahoma | 3,450,654 | +9 | 3,751,351 | +7 | 4,024,202 | +7 | 4,302,501 |
Oklahoma County | 660,448 | +9 | 718,633 | +7 | 772,053 | +6 | 821,230 |
Total Working Age Population:
Total Households:
Total Working Age Population:
Total Households:
Total Working Age Population:
Total Households: