Industrial Properties
1525 Southeast 29th Street Oklahoma City, OK 73129
1525 Southeast 29th Street Oklahoma City, OK 73129
Details & Description
Property Highlights
- • TLR Listing 2136
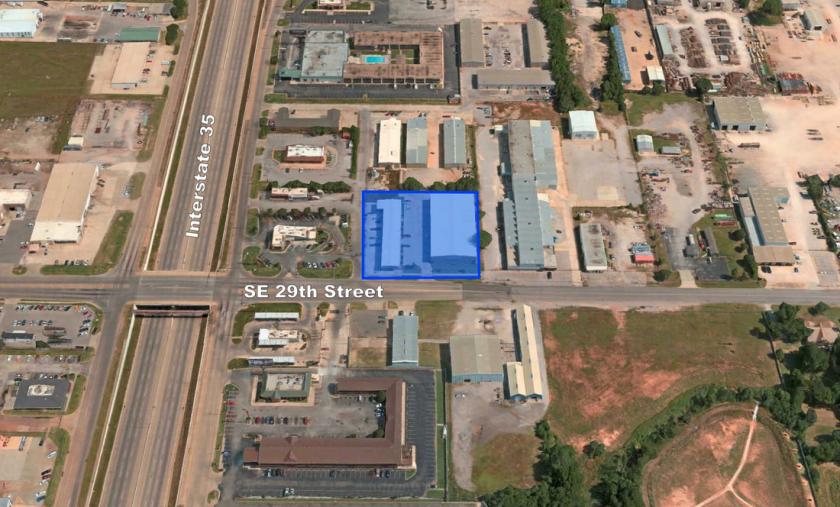
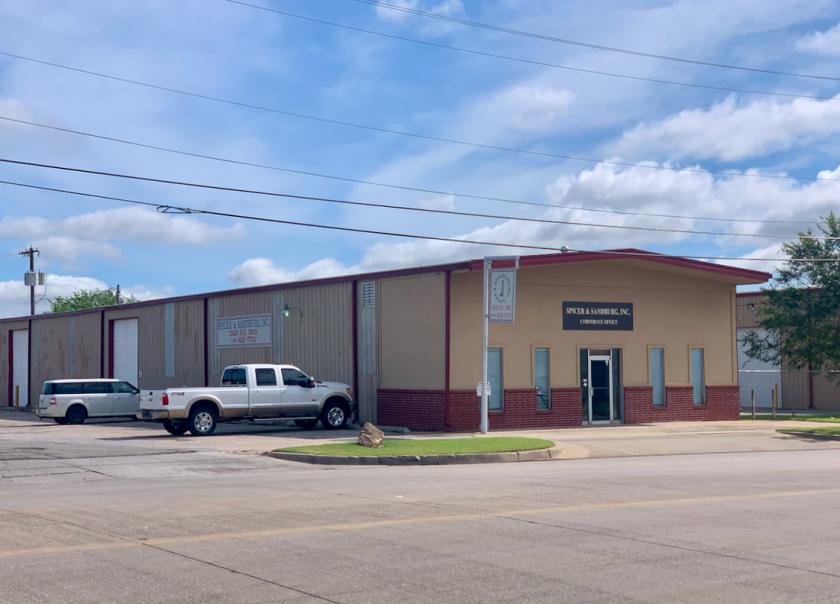
- • Address 1525 1529 SE 29th St, Oklahoma City, OK
- • Current Status Available For Sale
- • Two 2 buildings being 8,385 SF 20,000 SF
- • 1.5 acres of land
- • Zoned I-2 Industrial
Listing Agents

Ron Gary
O: 405-721-5588
M: 405-476-0746
ron@thomaslay.com
O: 405-721-5588
M: 405-476-0746
ron@thomaslay.com
While we strive to provide the most accurate information, all listing information, and demographic data, is provided by third-parties. As such, MyEListing will not be responsible for the accuracy of the information. It is strongly recommended that you verify all information with the listing agent, and any relevant agencies, prior to making any decisions.