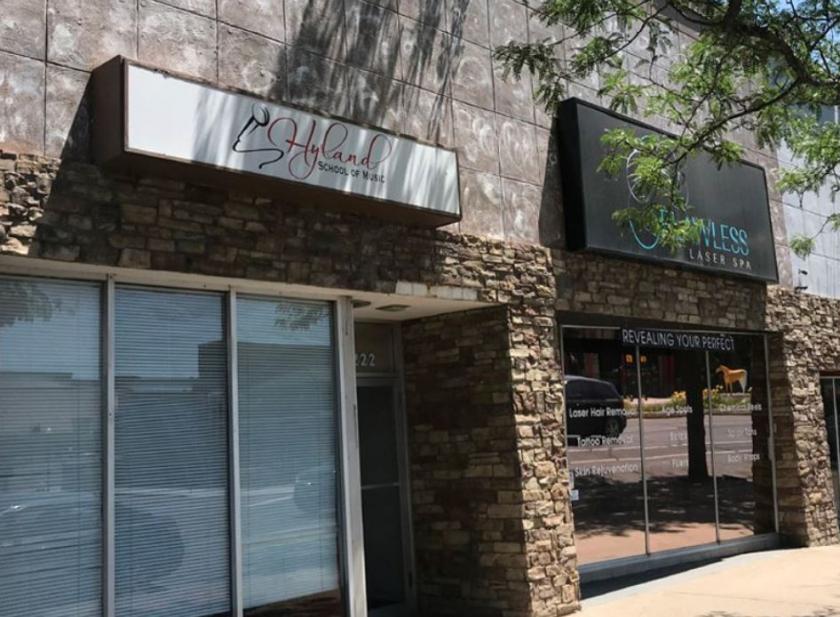
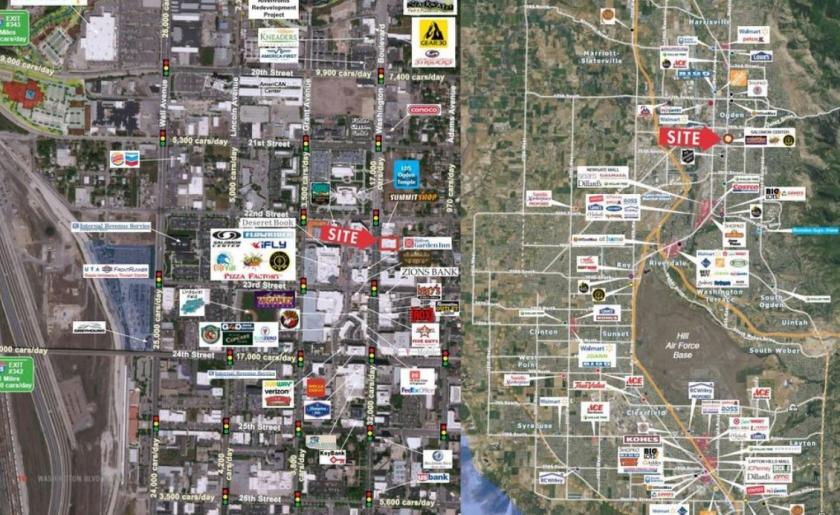
1-Mile | 3-Miles | 5-Miles | ||
---|---|---|---|---|
Total Population | 13,976 | 80,512 | 148,301 | |
Population Median Age | 33 | 34 | 34 | |
Population by Age | 0-9 Yrs | 1816 (12%) | 12022 (14%) | 23365 (15%) |
10-19 Yrs | 2182 (15%) | 12109 (15%) | 21504 (14%) | |
20-29 Yrs | 2662 (19%) | 13600 (16%) | 24520 (16%) | |
30-39 Yrs | 2287 (16%) | 13122 (16%) | 23060 (15%) | |
40-49 Yrs | 1808 (12%) | 9601 (11%) | 16939 (11%) | |
50-59 Yrs | 1478 (10%) | 8373 (10%) | 14735 (9%) | |
60-69 Yrs | 1057 (7%) | 6215 (7%) | 12788 (8%) | |
70+ Yrs | 687 (4%) | 5471 (6%) | 11391 (7%) | |
Median HH Income | $33,134 | $48,486 | $57,276 | |
Total Household Income | < 24K | 1977 (35%) | 6617 (23%) | 9528 (18%) |
25-49K | 1751 (31%) | 8208 (28%) | 13077 (25%) | |
50-74K | 920 (16%) | 5632 (19%) | 10726 (20%) | |
75-99K | 435 (7%) | 3953 (13%) | 7851 (15%) | |
100-199K | 370 (6%) | 3679 (12%) | 8939 (17%) | |
200K+ | 83 (1%) | 595 (2%) | 1492 (2%) | |
Highest Education Level | No Diploma | 1791 | 8248 | 11371 |
Diploma or GED | 2809 | 15343 | 28037 | |
Some College | 2220 | 13089 | 24539 | |
Assoc. Degree | 576 | 3703 | 7478 | |
Bachelors Degree | 895 | 6423 | 13882 | |
Higher Degree | 371 | 2973 | 6408 | |
Total Housing Units | 6,311 | 31,489 | 55,791 | |
--Owner-Occupied | 1,787 | 16,266 | 33,314 | |
--Renter-Occupied | 3,749 | 12,419 | 18,298 | |
Owner-Occupied Values | < 100K | 414 | 2462 | 4349 |
100-199K | 847 | 8276 | 14215 | |
200-299K | 369 | 4029 | 9371 | |
300-399K | 60 | 892 | 2805 | |
400-499K | 41 | 332 | 1405 | |
500K+ | 56 | 275 | 1169 | |
Total Working Age Population | 10,677 | 60,852 | 111,133 | |
In Work Force | 6,711 | 40,582 | 74,736 | |
Not In Work Force | 3,966 | 20,269 | 36,397 | |
Workforce Employed | 6,309 | 38,526 | 71,423 | |
Workforce Unemployed | 363 | 1,917 | 3,045 | |
Civlian Workforce | 6,671 | 40,443 | 74,468 | |
Military Workforce | 39 | 139 | 268 | |
Total Households | 5,536 | 28,684 | 51,613 | |
Family Households | 2,741 | 18,042 | 35,170 | |
Non-Family Households | 2,795 | 10,642 | 16,442 | |
Married Couple | 1,642 | 12,180 | 25,397 | |
Other Family | 1,099 | 5,862 | 9,773 | |
Married w/Child | 854 | 5,820 | 11,822 | |
Single Male w/Child | 199 | 840 | 1,736 | |
Single Female w/Child | 548 | 2,577 | 4,021 |
Population Change Last Two Decades - Plus Projection
2000 | % | 2010 | % | 2020 | % | 2030 | |
---|---|---|---|---|---|---|---|
Utah | 2,233,169 | +24 | 2,763,885 | +20 | 3,325,425 | +17 | 3,889,310 |
Box Elder County | 42,745 | +17 | 49,975 | +15 | 57,479 | +12 | 64,263 |
Morgan County | 7,129 | +33 | 9,469 | +42 | 13,443 | +31 | 17,612 |
Weber County | 196,533 | +18 | 231,236 | +15 | 266,440 | +14 | 302,764 |
Total Working Age Population:
Total Households:
Total Working Age Population:
Total Households:
Total Working Age Population:
Total Households: