Office Space
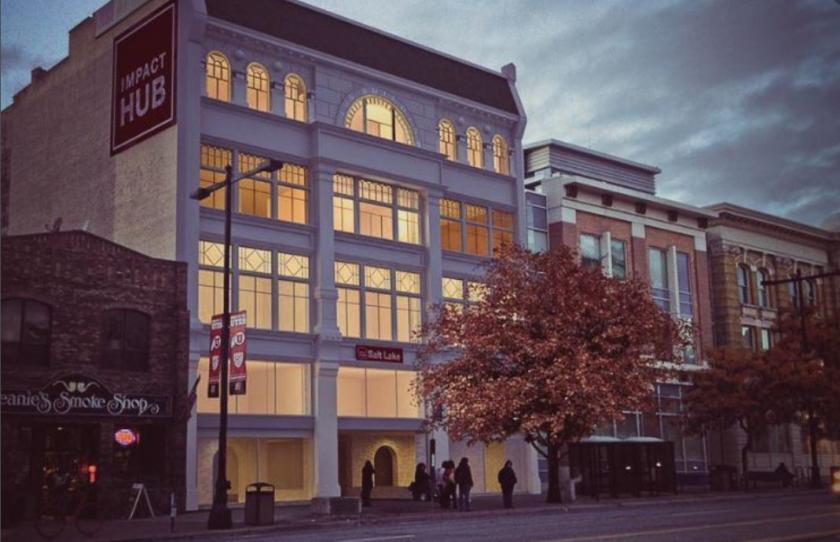
150 South State Street Salt Lake City, UT 84111
150 South State Street Salt Lake City, UT 84111
Details & Description
Property Highlights
• This Building was Built as a Warehouse in the Early 1900s and has Recently Undergone Some Interior Upgrades
• Walking Distance to Shopping, Temple Square, The Alta Club, Trax and Numerous Local Restaurants
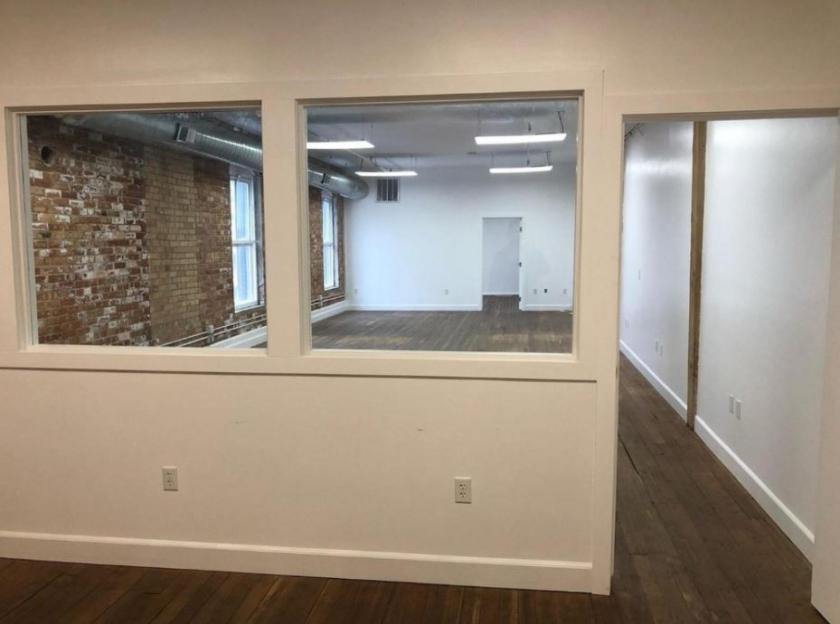
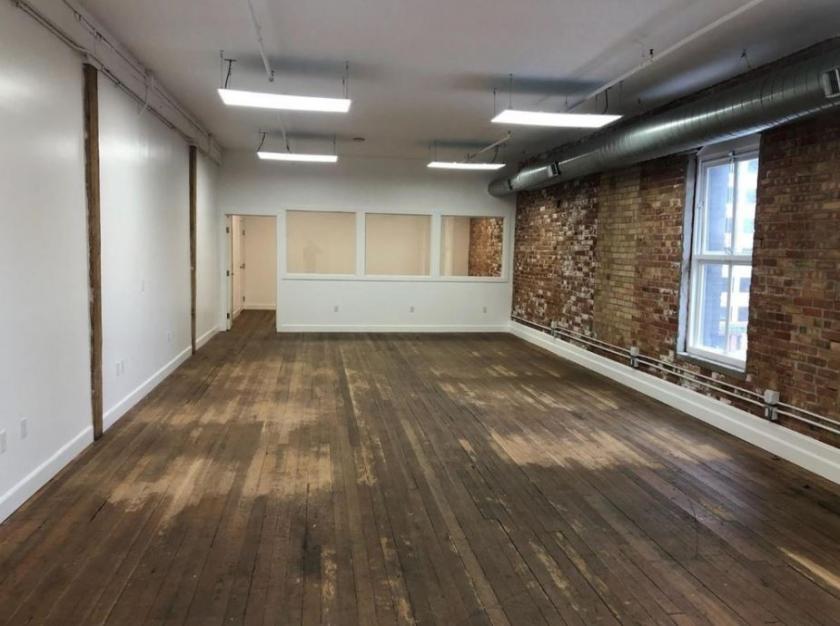
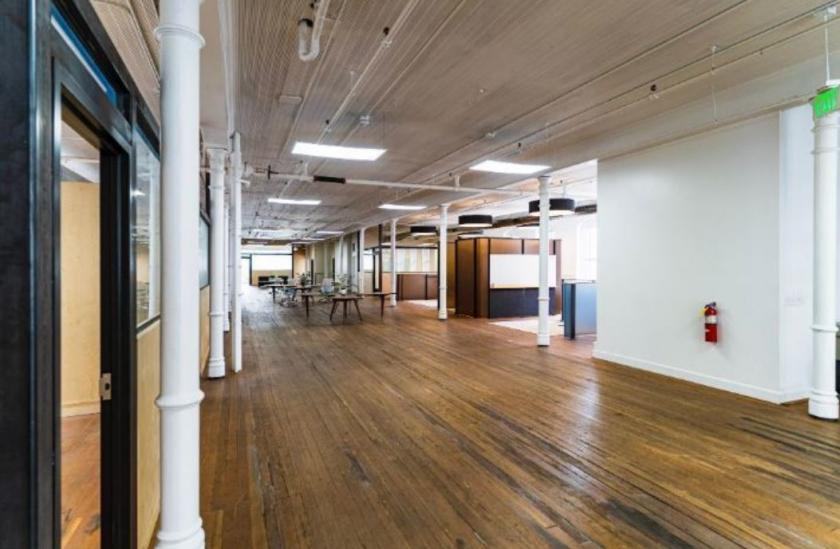
Additional Photos

Listing Agents

Andy Renfro
O: 801-706-7845
andy@iproperties.com
O: 801-706-7845
andy@iproperties.com
While we strive to provide the most accurate information, all listing information, and demographic data, is provided by third-parties. As such, MyEListing will not be responsible for the accuracy of the information. It is strongly recommended that you verify all information with the listing agent, and any relevant agencies, prior to making any decisions.


