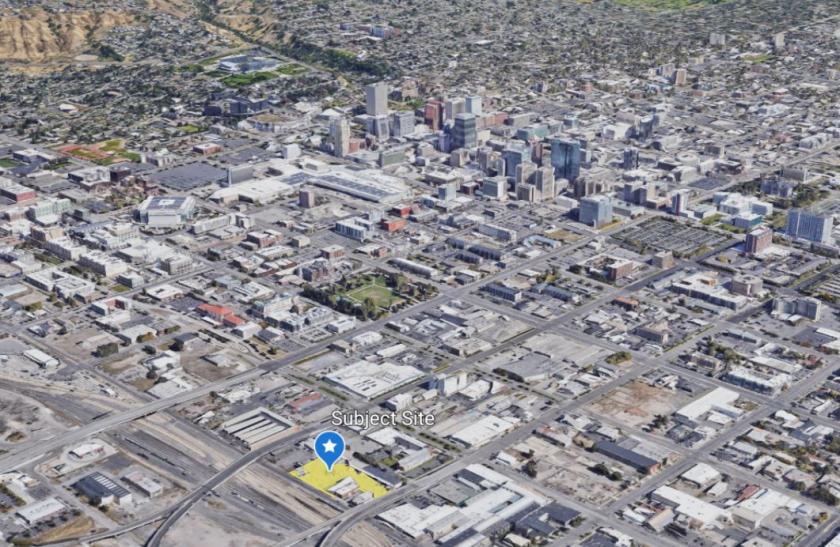
Commercial Land
546-562 West 600 South Salt Lake City, UT 84101
546-562 West 600 South Salt Lake City, UT 84101
Details & Description
Property Highlights
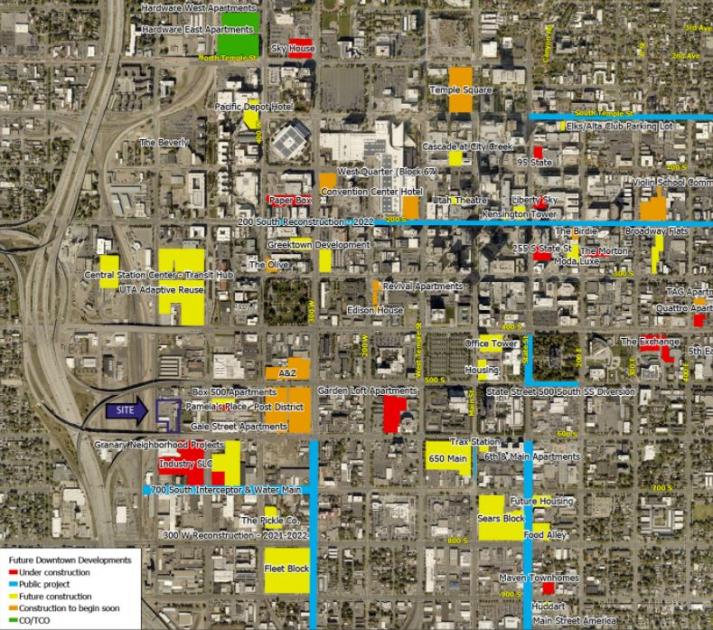
- • Opportunity Zone Land
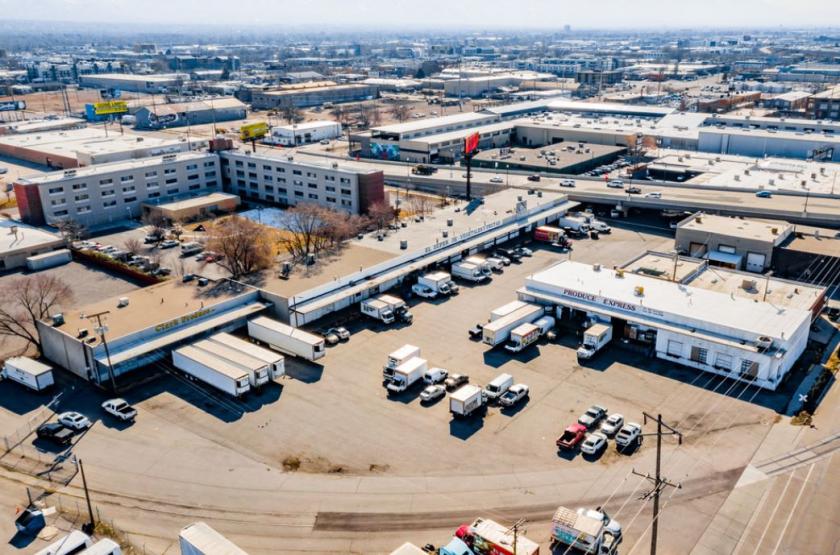
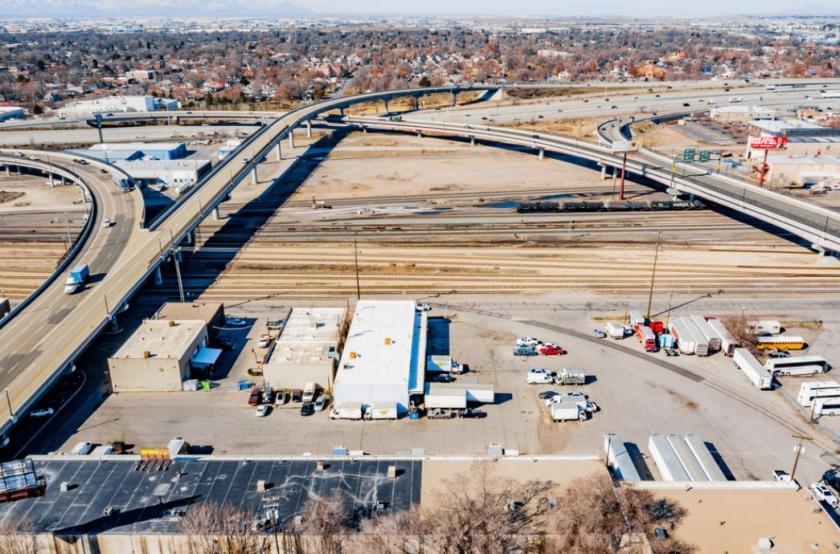
- • Prime Site for Development or Distribution
- • Zoned CG General Commercial
Additional Photos

Listing Agents

Michael Ferro
O: 801-554-3002
ferro@iproperties.com
O: 801-554-3002
ferro@iproperties.com
While we strive to provide the most accurate information, all listing information, and demographic data, is provided by third-parties. As such, MyEListing will not be responsible for the accuracy of the information. It is strongly recommended that you verify all information with the listing agent, and any relevant agencies, prior to making any decisions.


