Commercial Land
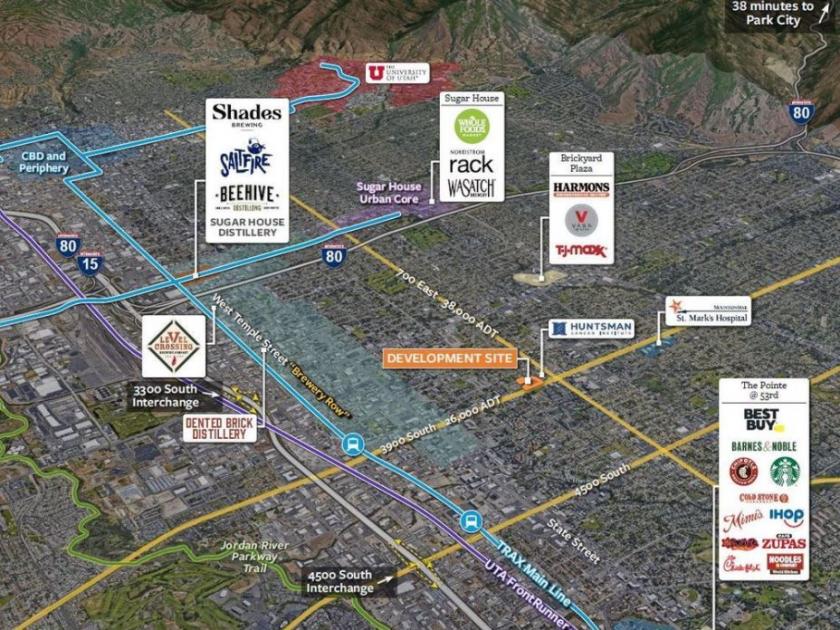
700 East 3900 South Salt Lake City, UT 84107
700 East 3900 South Salt Lake City, UT 84107
Details & Description
Property Highlights
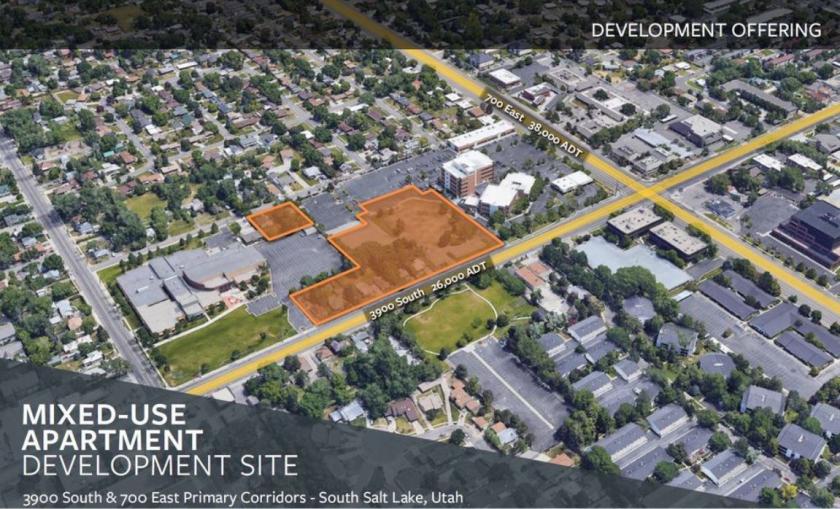
• Mixed-Use Zoning requires a minimum of 4,000 sq. ft. of commercial or retail space on the ground-floor
• Positioned for moderate-density development approx. 100 units see Offering Memorandum for details
Listing Agents

Jake Copinga
M: 801-706-9754
jake@iproperties.com
M: 801-706-9754
jake@iproperties.com
While we strive to provide the most accurate information, all listing information, and demographic data, is provided by third-parties. As such, MyEListing will not be responsible for the accuracy of the information. It is strongly recommended that you verify all information with the listing agent, and any relevant agencies, prior to making any decisions.