Office Space
307 West 200 South Salt Lake City, UT 84101
307 West 200 South Salt Lake City, UT 84101
Details & Description
Property Highlights
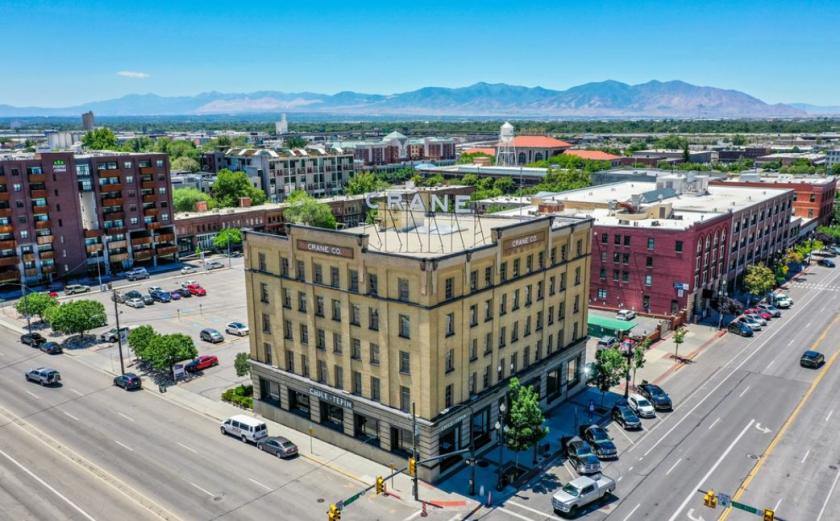
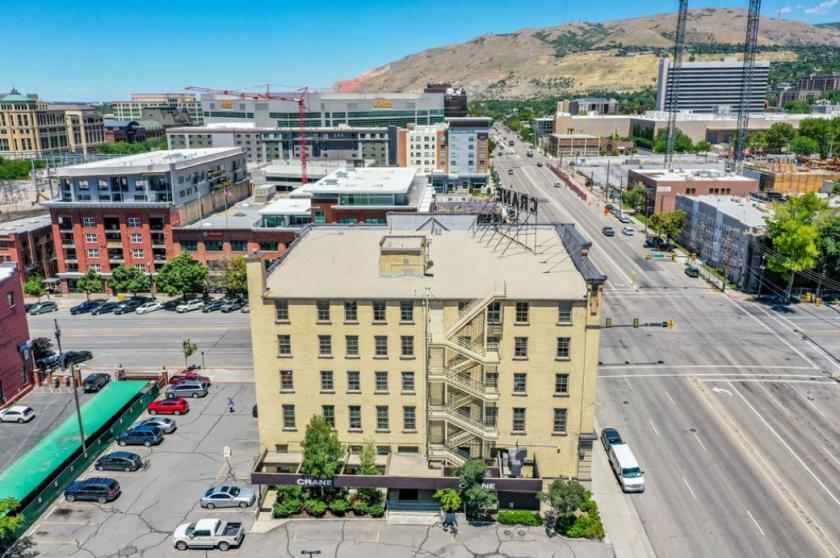
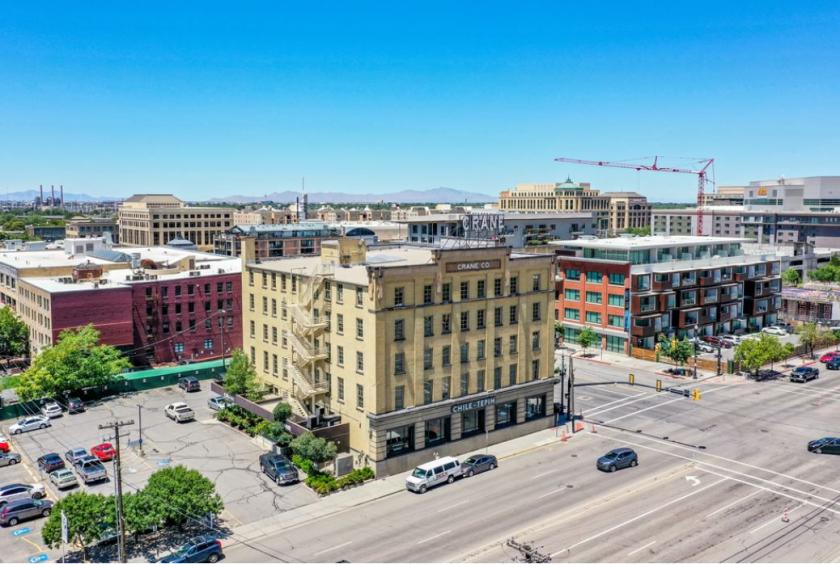
- • Historic Downtown Office Building
- • Creative Unique Loft Style Offices
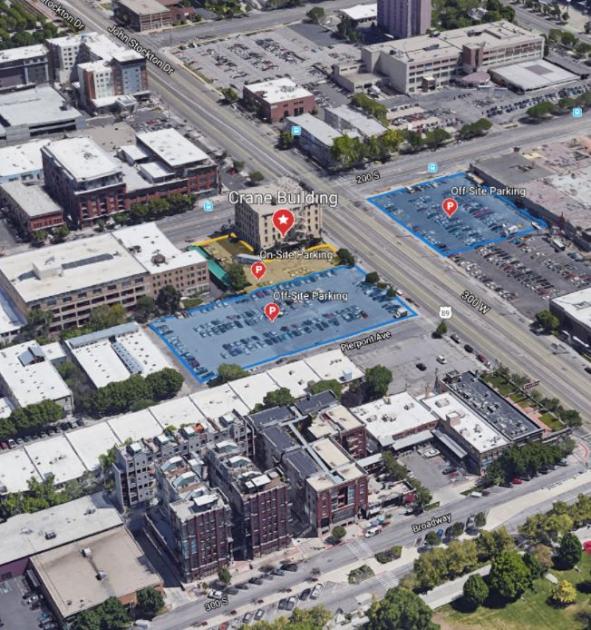
- • On-Site Off-Site Parking Available
- • Surrounded by Local Retailers Restaurants
Additional Photos

Listing Agents

Jake Copinga
M: 801-706-9754
jake@iproperties.com
M: 801-706-9754
jake@iproperties.com
While we strive to provide the most accurate information, all listing information, and demographic data, is provided by third-parties. As such, MyEListing will not be responsible for the accuracy of the information. It is strongly recommended that you verify all information with the listing agent, and any relevant agencies, prior to making any decisions.


