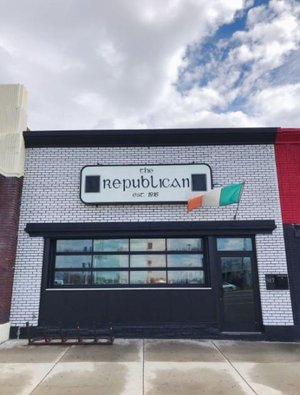
1-Mile | 3-Miles | 5-Miles | ||
---|---|---|---|---|
Total Population | 14,684 | 146,850 | 281,527 | |
Population Median Age | 36 | 35 | 35 | |
Population by Age | 0-9 Yrs | 1731 (11%) | 16524 (11%) | 36448 (12%) |
10-19 Yrs | 1115 (7%) | 14667 (9%) | 32211 (11%) | |
20-29 Yrs | 3570 (24%) | 35687 (24%) | 60451 (21%) | |
30-39 Yrs | 2788 (18%) | 26711 (18%) | 48645 (17%) | |
40-49 Yrs | 1750 (11%) | 16335 (11%) | 32863 (11%) | |
50-59 Yrs | 1483 (10%) | 14581 (9%) | 27842 (9%) | |
60-69 Yrs | 1338 (9%) | 12883 (8%) | 23836 (8%) | |
70+ Yrs | 908 (6%) | 9460 (6%) | 19231 (6%) | |
Median HH Income | $42,044 | $55,154 | $58,101 | |
Total Household Income | < 24K | 2388 (33%) | 14279 (22%) | 21958 (19%) |
25-49K | 1508 (21%) | 14491 (23%) | 25803 (23%) | |
50-74K | 1098 (15%) | 11503 (18%) | 20562 (18%) | |
75-99K | 841 (11%) | 7532 (12%) | 14279 (12%) | |
100-199K | 963 (13%) | 10784 (17%) | 20523 (18%) | |
200K+ | 256 (3%) | 3881 (6%) | 7188 (6%) | |
Highest Education Level | No Diploma | 1436 | 12724 | 22414 |
Diploma or GED | 2231 | 18288 | 37112 | |
Some College | 2541 | 18609 | 36581 | |
Assoc. Degree | 701 | 6630 | 13453 | |
Bachelors Degree | 2225 | 24171 | 44083 | |
Higher Degree | 1405 | 18765 | 32152 | |
Total Housing Units | 7,774 | 68,016 | 119,184 | |
--Owner-Occupied | 1,948 | 26,044 | 51,980 | |
--Renter-Occupied | 5,106 | 36,426 | 58,333 | |
Owner-Occupied Values | < 100K | 59 | 1259 | 3280 |
100-199K | 500 | 6169 | 11409 | |
200-299K | 640 | 6683 | 13330 | |
300-399K | 390 | 4433 | 9126 | |
400-499K | 102 | 2945 | 5739 | |
500K+ | 258 | 4554 | 9097 | |
Total Working Age Population | 12,210 | 121,886 | 226,596 | |
In Work Force | 8,373 | 88,899 | 163,357 | |
Not In Work Force | 3,836 | 32,987 | 63,238 | |
Workforce Employed | 8,047 | 85,534 | 156,859 | |
Workforce Unemployed | 320 | 3,265 | 6,364 | |
Civlian Workforce | 8,367 | 88,799 | 163,222 | |
Military Workforce | 6 | 100 | 135 | |
Total Households | 7,054 | 62,469 | 110,313 | |
Family Households | 2,634 | 28,225 | 58,505 | |
Non-Family Households | 4,420 | 34,244 | 51,808 | |
Married Couple | 1,740 | 20,199 | 41,950 | |
Other Family | 894 | 8,026 | 16,556 | |
Married w/Child | 605 | 7,799 | 18,158 | |
Single Male w/Child | 111 | 1,345 | 2,593 | |
Single Female w/Child | 401 | 2,688 | 6,011 |
Population Change Last Two Decades - Plus Projection
2000 | % | 2010 | % | 2020 | % | 2030 | |
---|---|---|---|---|---|---|---|
Utah | 2,233,169 | +24 | 2,763,885 | +20 | 3,325,425 | +17 | 3,889,310 |
Davis County | 238,994 | +28 | 306,479 | +19 | 364,813 | +11 | 406,046 |
Morgan County | 7,129 | +33 | 9,469 | +42 | 13,443 | +31 | 17,612 |
Salt Lake County | 898,387 | +15 | 1,029,655 | +15 | 1,181,471 | +11 | 1,306,414 |
Total Working Age Population:
Total Households:
Total Working Age Population:
Total Households:
Total Working Age Population:
Total Households: