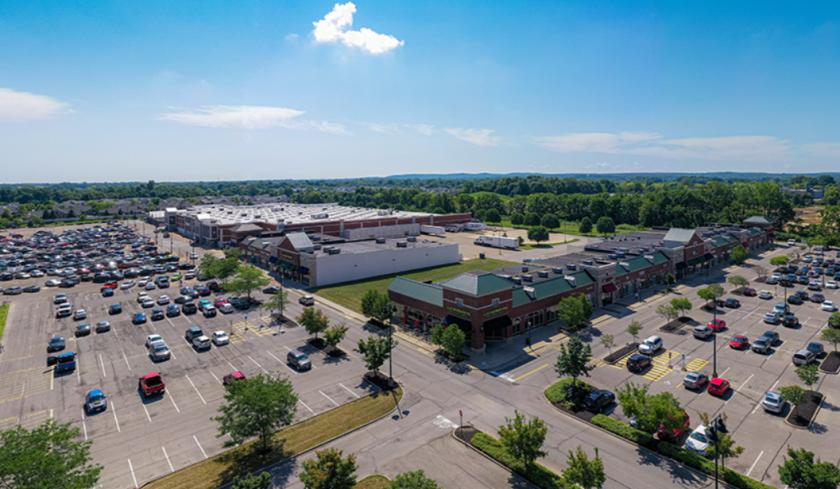
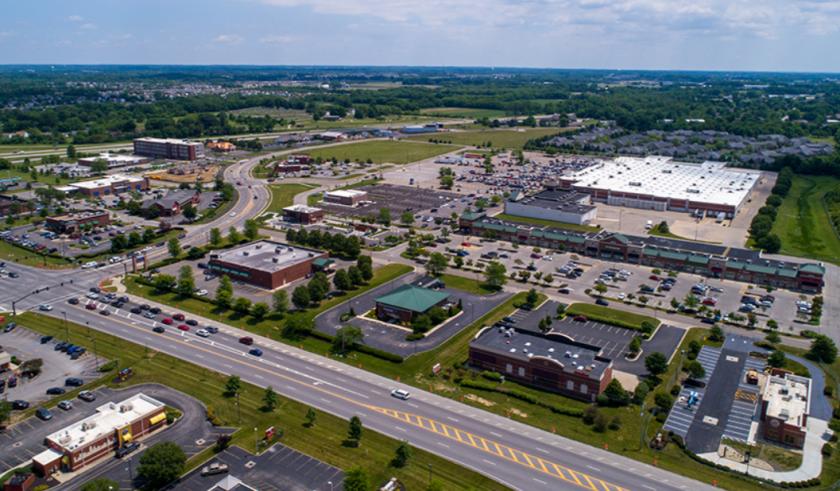
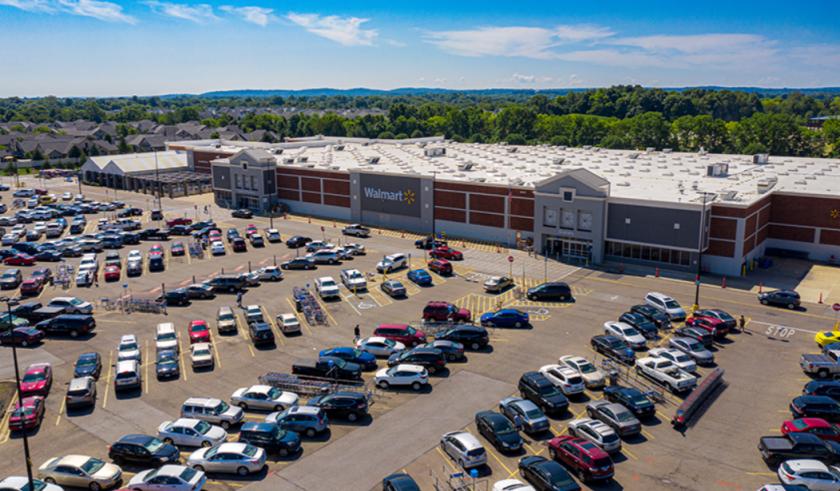
1-Mile | 3-Miles | 5-Miles | ||
---|---|---|---|---|
Total Population | 5,095 | 27,995 | 94,135 | |
Population Median Age | 38 | 36 | 35 | |
Population by Age | 0-9 Yrs | 718 (14%) | 4231 (15%) | 14408 (15%) |
10-19 Yrs | 662 (12%) | 3739 (13%) | 13630 (14%) | |
20-29 Yrs | 742 (14%) | 3597 (12%) | 11809 (12%) | |
30-39 Yrs | 615 (12%) | 4450 (15%) | 14948 (15%) | |
40-49 Yrs | 601 (11%) | 3985 (14%) | 13208 (14%) | |
50-59 Yrs | 618 (12%) | 2990 (10%) | 10769 (11%) | |
60-69 Yrs | 563 (11%) | 2769 (9%) | 9316 (9%) | |
70+ Yrs | 576 (11%) | 2234 (7%) | 6046 (6%) | |
Median HH Income | $75,490 | $69,424 | $66,119 | |
Total Household Income | < 24K | 185 (10%) | 896 (8%) | 3943 (11%) |
25-49K | 368 (21%) | 2594 (24%) | 8224 (23%) | |
50-74K | 301 (17%) | 2200 (20%) | 7369 (21%) | |
75-99K | 277 (16%) | 1380 (12%) | 4437 (12%) | |
100-199K | 492 (28%) | 3102 (29%) | 9174 (26%) | |
200K+ | 96 (5%) | 471 (4%) | 1202 (3%) | |
Highest Education Level | No Diploma | 145 | 875 | 3971 |
Diploma or GED | 1222 | 5704 | 19075 | |
Some College | 838 | 3821 | 14294 | |
Assoc. Degree | 235 | 1839 | 5524 | |
Bachelors Degree | 698 | 4037 | 12399 | |
Higher Degree | 346 | 2472 | 6119 | |
Total Housing Units | 1,750 | 11,103 | 36,194 | |
--Owner-Occupied | 1,098 | 6,319 | 21,533 | |
--Renter-Occupied | 621 | 4,324 | 12,817 | |
Owner-Occupied Values | < 100K | 35 | 572 | 3454 |
100-199K | 685 | 3265 | 11171 | |
200-299K | 294 | 1827 | 5257 | |
300-399K | 70 | 539 | 1278 | |
400-499K | 9 | 75 | 193 | |
500K+ | 3 | 42 | 181 | |
Total Working Age Population | 3,974 | 21,476 | 71,119 | |
In Work Force | 2,591 | 15,043 | 50,750 | |
Not In Work Force | 1,382 | 6,432 | 20,369 | |
Workforce Employed | 2,487 | 14,563 | 48,705 | |
Workforce Unemployed | 105 | 459 | 1,925 | |
Civlian Workforce | 2,591 | 15,022 | 50,630 | |
Military Workforce | 0 | 21 | 121 | |
Total Households | 1,719 | 10,643 | 34,350 | |
Family Households | 1,239 | 6,906 | 23,783 | |
Non-Family Households | 480 | 3,736 | 10,567 | |
Married Couple | 935 | 5,157 | 16,662 | |
Other Family | 305 | 1,749 | 7,120 | |
Married w/Child | 386 | 2,420 | 7,835 | |
Single Male w/Child | 30 | 382 | 1,174 | |
Single Female w/Child | 47 | 491 | 2,963 |
Population Change Last Two Decades - Plus Projection
2000 | % | 2010 | % | 2020 | % | 2030 | |
---|---|---|---|---|---|---|---|
Ohio | 11,353,140 | +2 | 11,536,504 | 0 | 11,574,870 | 0 | 11,615,100 |
Fairfield County | 122,759 | +19 | 146,156 | +7 | 157,040 | +9 | 170,630 |
Franklin County | 1,068,978 | +9 | 1,163,414 | +11 | 1,291,320 | +8 | 1,394,980 |
Licking County | 145,491 | +14 | 166,492 | +9 | 180,860 | +9 | 196,570 |
Pickaway County | 52,727 | +6 | 55,698 | +4 | 58,010 | +4 | 60,560 |
Total Working Age Population:
Total Households:
Total Working Age Population:
Total Households:
Total Working Age Population:
Total Households: