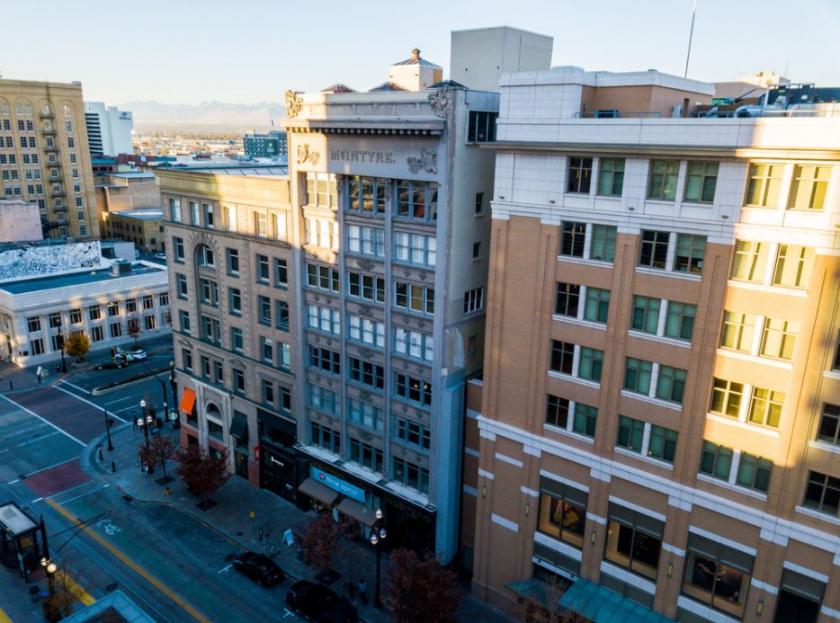
Office Space
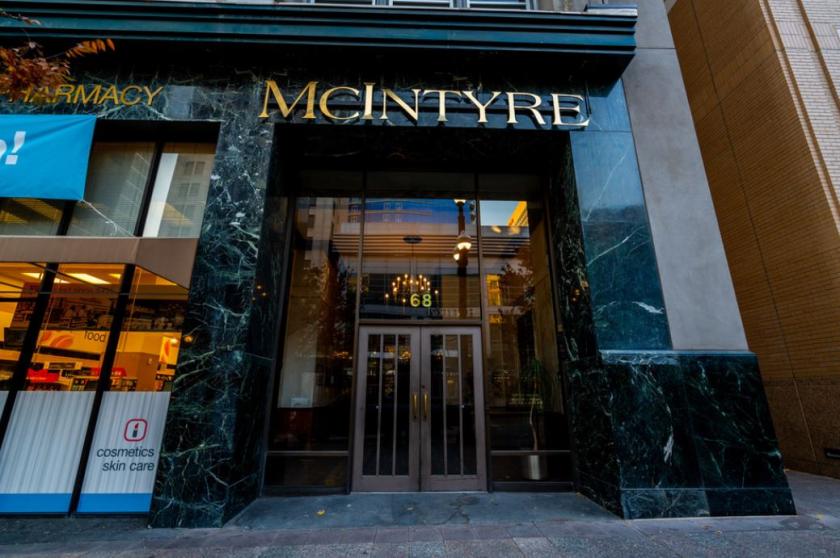
68 South Main Street Salt Lake City, UT 84101
68 South Main Street Salt Lake City, UT 84101
Details & Description
Property Highlights
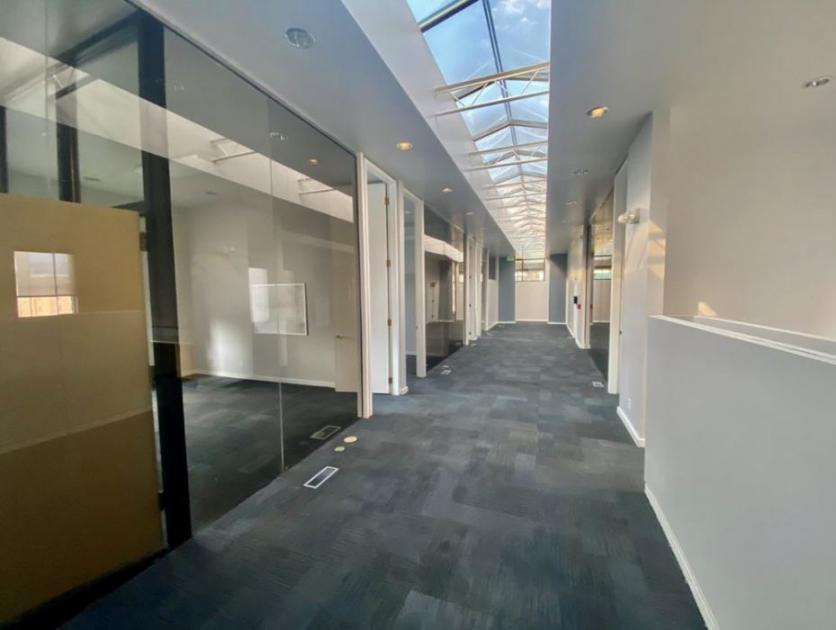
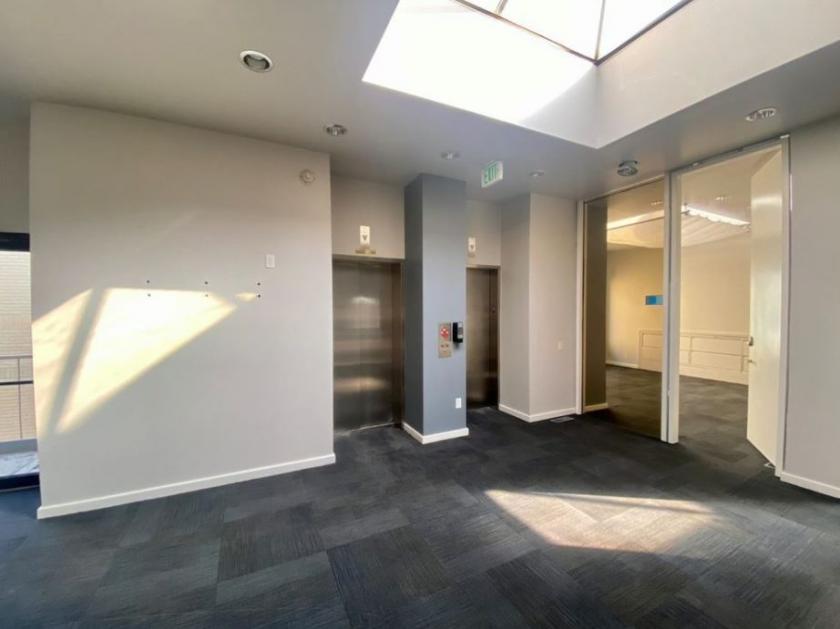
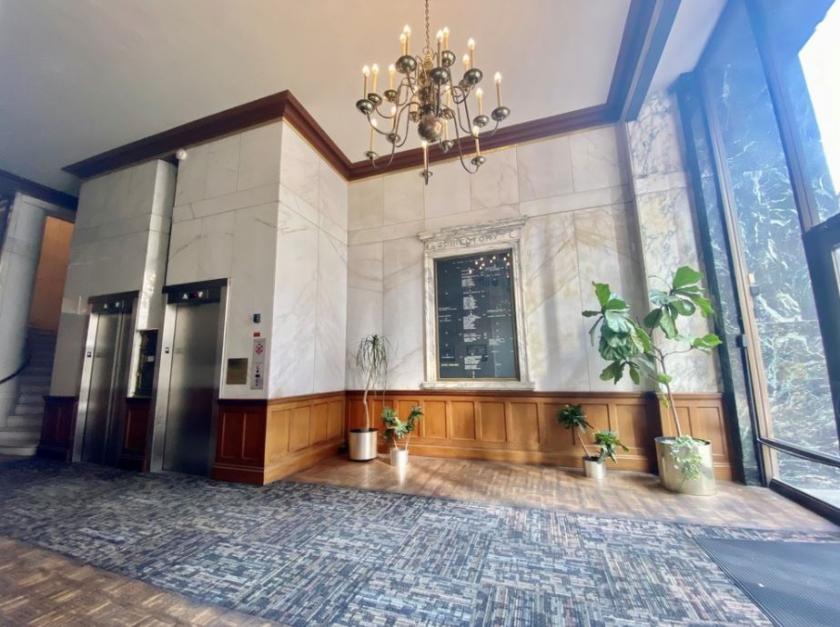
- • Penthouse Office in Historic McIntyre Building
- • Furnishings Available
- • Wrap Around Balconies Offer Amazing Views
- • Parking Available at the City Creek Center
- • Available August 1st, 2020
Additional Photos
Listing Agents

Christian Priskos
O: 801-573-8500
christian@iproperties.com
O: 801-573-8500
christian@iproperties.com
While we strive to provide the most accurate information, all listing information, and demographic data, is provided by third-parties. As such, MyEListing will not be responsible for the accuracy of the information. It is strongly recommended that you verify all information with the listing agent, and any relevant agencies, prior to making any decisions.


