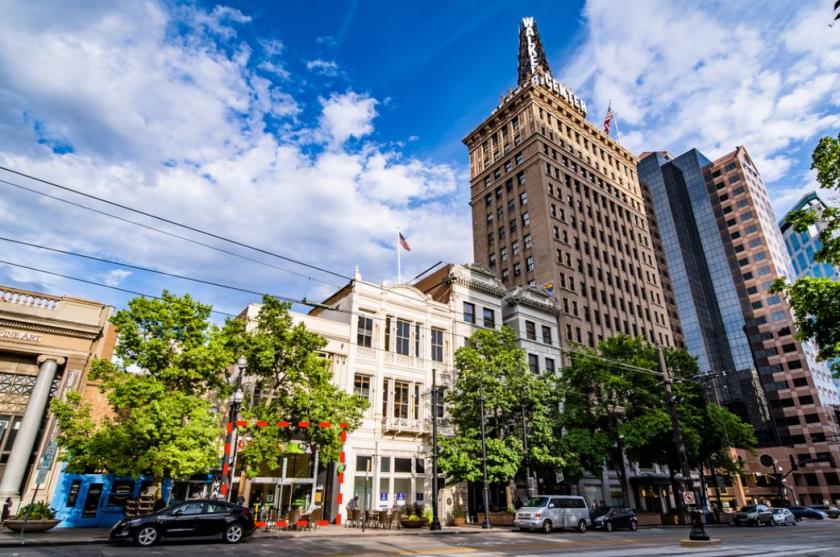
Retail Space
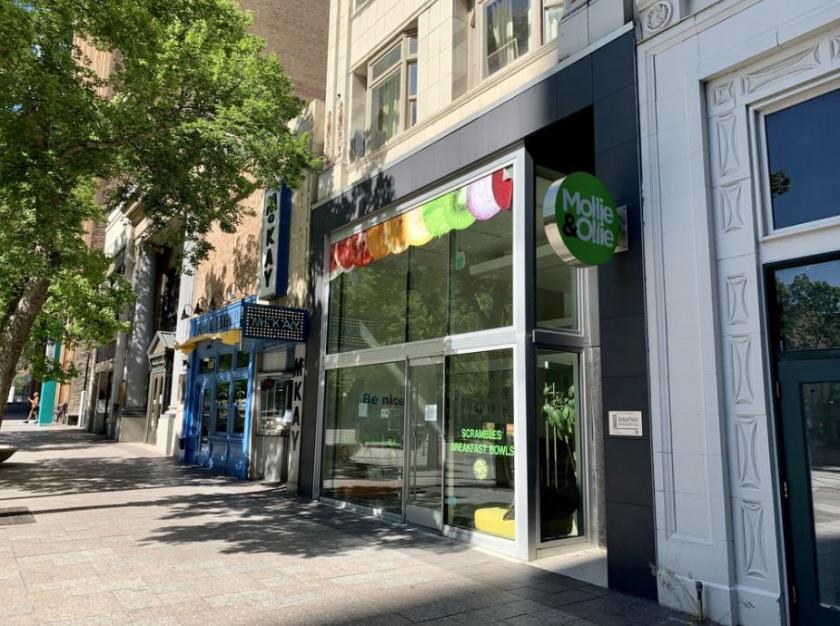
159 South Main Street Salt Lake City, UT 84111
159 South Main Street Salt Lake City, UT 84111
Details & Description
Property Highlights
• Steps Away from Eccles Theatre, High Rise Office Towers, City Creek Center Salt Palace Convention Center
• Close to New Development Projects, Hotels, Multiple TRAX Stations all Downtown Amenities
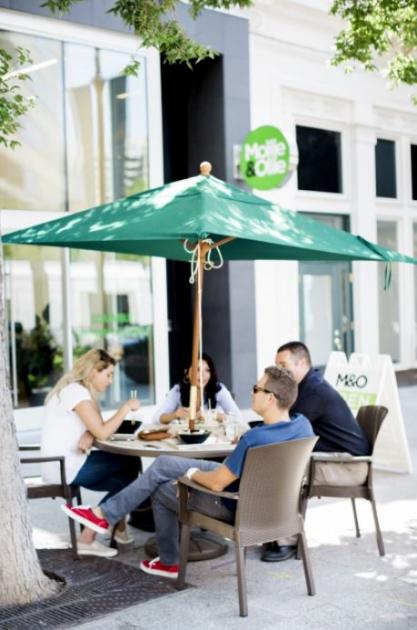
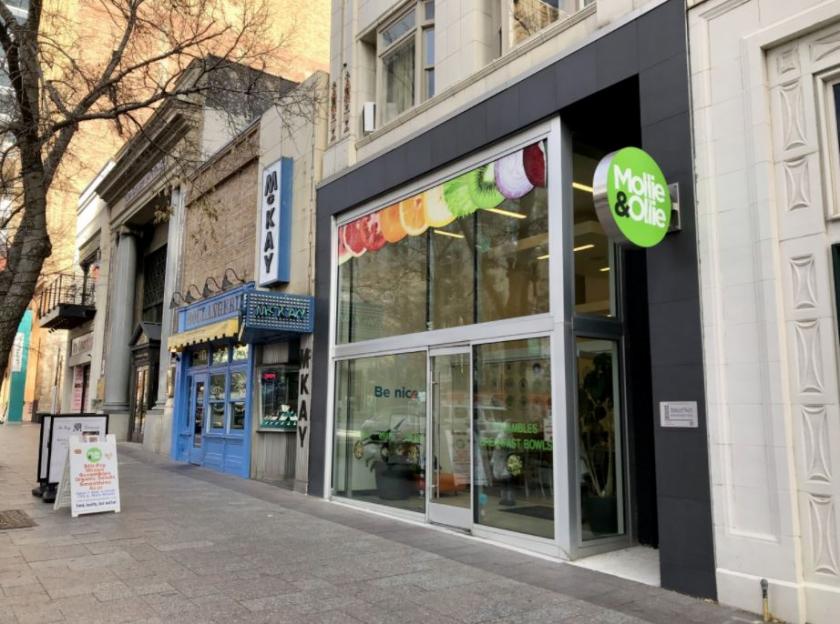
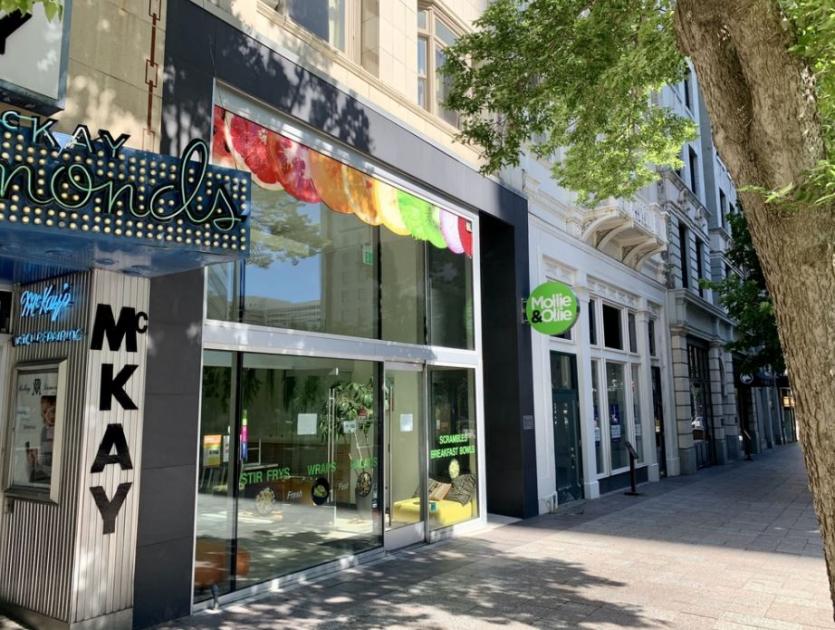
Additional Photos
Listing Agents

Chris Metos
O: 801-879-7870
chris@iproperties.com
O: 801-879-7870
chris@iproperties.com
While we strive to provide the most accurate information, all listing information, and demographic data, is provided by third-parties. As such, MyEListing will not be responsible for the accuracy of the information. It is strongly recommended that you verify all information with the listing agent, and any relevant agencies, prior to making any decisions.


