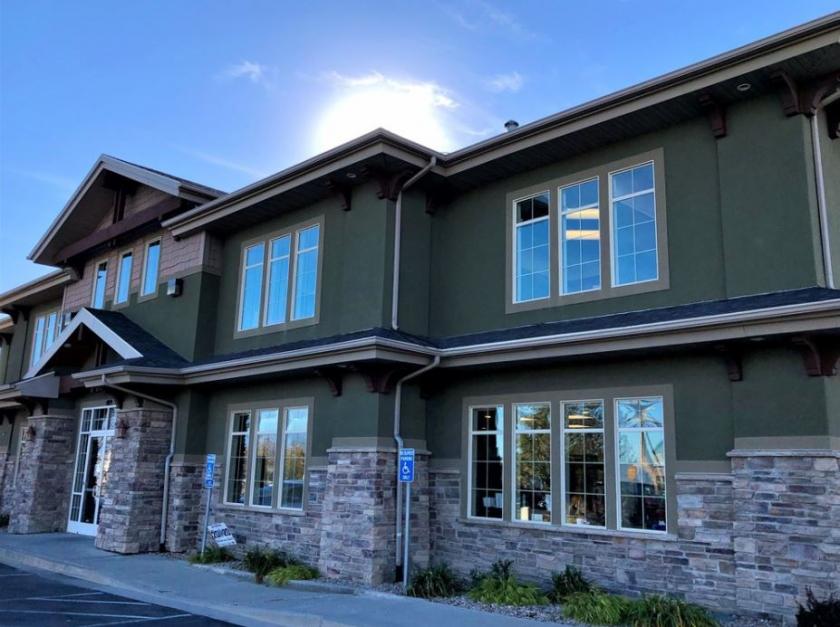
Office Space
4019 West 12600 South Riverton, UT 84096
4019 West 12600 South Riverton, UT 84096
Details & Description
Property Highlights
• Adequate Natural Light in Most Exam Areas Offices Plus Efficient Floor Plan Configuration
• High Traffic Count and Great Accessibility Located Next to Bangerter Highway
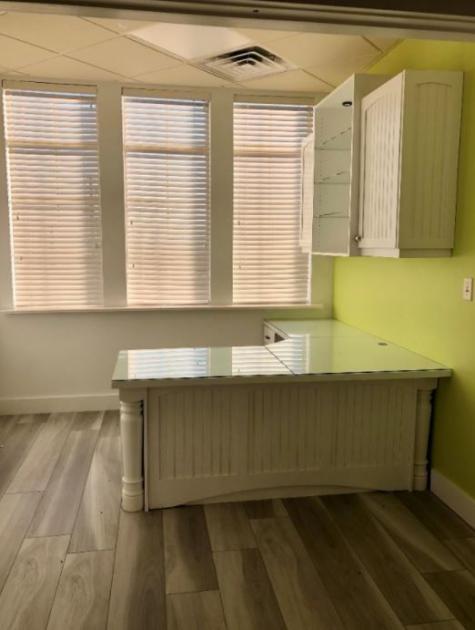
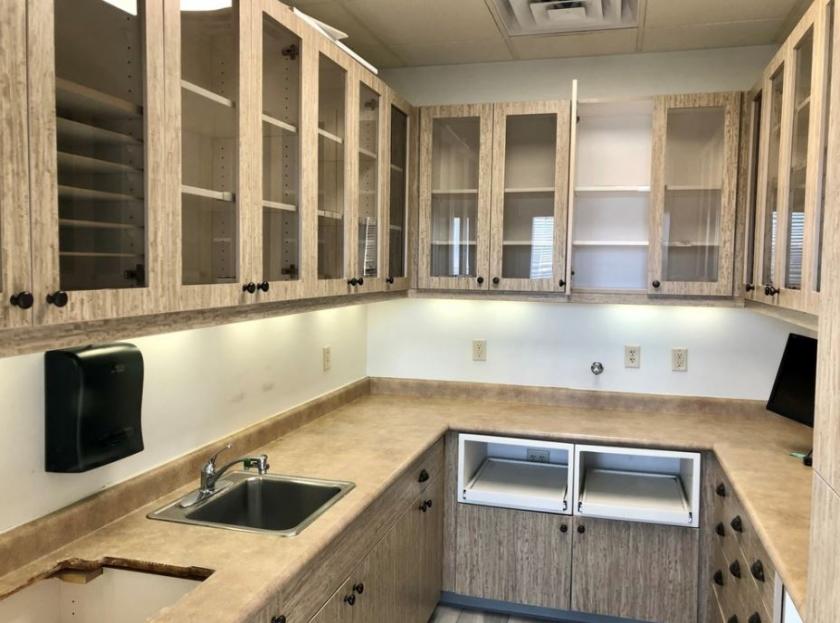
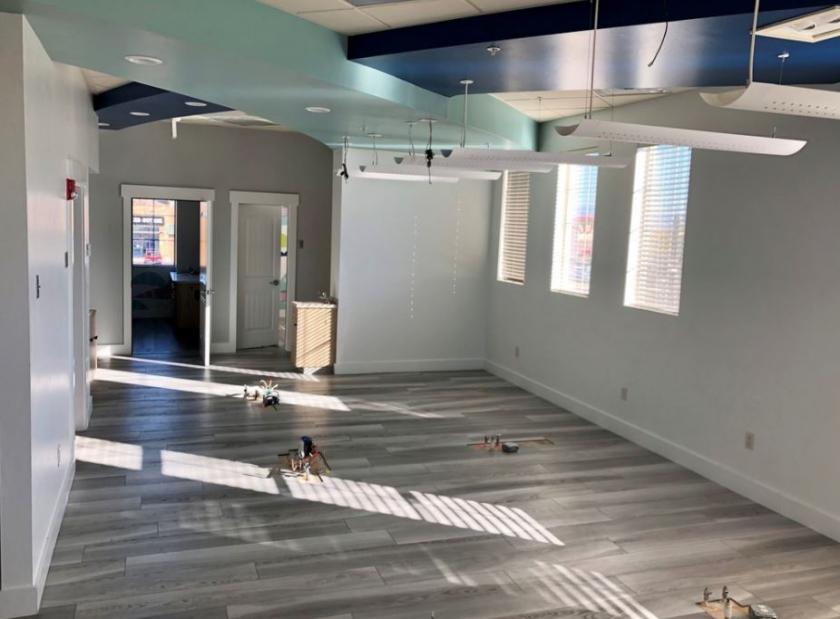
Additional Photos

Listing Agents

Chris Metos
O: 801-879-7870
chris@iproperties.com
O: 801-879-7870
chris@iproperties.com
While we strive to provide the most accurate information, all listing information, and demographic data, is provided by third-parties. As such, MyEListing will not be responsible for the accuracy of the information. It is strongly recommended that you verify all information with the listing agent, and any relevant agencies, prior to making any decisions.


